Bhutanese vs Polish Professional Degree
COMPARE
Bhutanese
Polish
Professional Degree
Professional Degree Comparison
Bhutanese
Poles
5.4%
PROFESSIONAL DEGREE
99.8/ 100
METRIC RATING
70th/ 347
METRIC RANK
4.6%
PROFESSIONAL DEGREE
72.6/ 100
METRIC RATING
151st/ 347
METRIC RANK
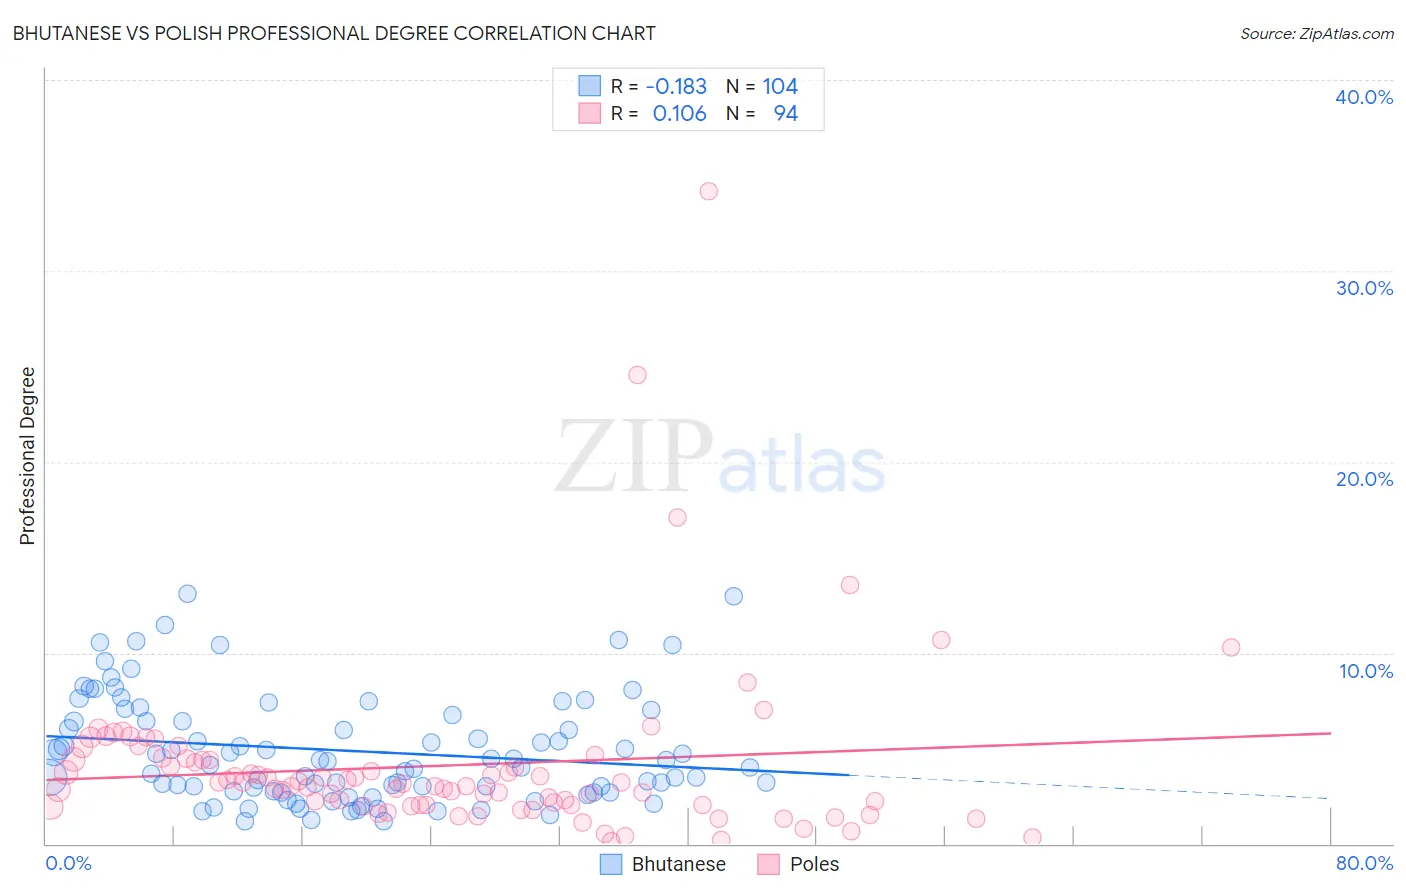
Bhutanese vs Polish Professional Degree Correlation Chart
The statistical analysis conducted on geographies consisting of 454,048,564 people shows a poor negative correlation between the proportion of Bhutanese and percentage of population with at least professional degree education in the United States with a correlation coefficient (R) of -0.183 and weighted average of 5.4%. Similarly, the statistical analysis conducted on geographies consisting of 553,734,682 people shows a poor positive correlation between the proportion of Poles and percentage of population with at least professional degree education in the United States with a correlation coefficient (R) of 0.106 and weighted average of 4.6%, a difference of 19.2%.
Professional Degree Correlation Summary
| Measurement | Bhutanese | Polish |
| Minimum | 1.2% | 0.12% |
| Maximum | 13.1% | 34.2% |
| Range | 12.0% | 34.0% |
| Mean | 4.9% | 4.1% |
| Median | 4.2% | 3.1% |
| Interquartile 25% (IQ1) | 2.7% | 2.0% |
| Interquartile 75% (IQ3) | 6.6% | 4.4% |
| Interquartile Range (IQR) | 3.8% | 2.4% |
| Standard Deviation (Sample) | 2.8% | 4.6% |
| Standard Deviation (Population) | 2.8% | 4.6% |
Similar Demographics by Professional Degree
Demographics Similar to Bhutanese by Professional Degree
In terms of professional degree, the demographic groups most similar to Bhutanese are Immigrants from Hungary (5.5%, a difference of 0.33%), Immigrants from Lebanon (5.5%, a difference of 0.41%), Immigrants from Bulgaria (5.5%, a difference of 0.59%), Immigrants from Western Asia (5.4%, a difference of 0.59%), and Immigrants from Kazakhstan (5.5%, a difference of 0.92%).
| Demographics | Rating | Rank | Professional Degree |
| Asians | 99.9 /100 | #63 | Exceptional 5.5% |
| Immigrants | Asia | 99.9 /100 | #64 | Exceptional 5.5% |
| Immigrants | Bolivia | 99.9 /100 | #65 | Exceptional 5.5% |
| Immigrants | Kazakhstan | 99.9 /100 | #66 | Exceptional 5.5% |
| Immigrants | Bulgaria | 99.9 /100 | #67 | Exceptional 5.5% |
| Immigrants | Lebanon | 99.9 /100 | #68 | Exceptional 5.5% |
| Immigrants | Hungary | 99.9 /100 | #69 | Exceptional 5.5% |
| Bhutanese | 99.8 /100 | #70 | Exceptional 5.4% |
| Immigrants | Western Asia | 99.8 /100 | #71 | Exceptional 5.4% |
| Lithuanians | 99.8 /100 | #72 | Exceptional 5.4% |
| Immigrants | Romania | 99.8 /100 | #73 | Exceptional 5.4% |
| Ethiopians | 99.7 /100 | #74 | Exceptional 5.4% |
| Immigrants | Indonesia | 99.7 /100 | #75 | Exceptional 5.3% |
| Immigrants | Canada | 99.7 /100 | #76 | Exceptional 5.3% |
| Immigrants | Ethiopia | 99.7 /100 | #77 | Exceptional 5.3% |
Demographics Similar to Poles by Professional Degree
In terms of professional degree, the demographic groups most similar to Poles are Immigrants from Africa (4.6%, a difference of 0.010%), Immigrants from Uruguay (4.6%, a difference of 0.020%), Immigrants from Oceania (4.6%, a difference of 0.14%), Scottish (4.6%, a difference of 0.14%), and Slavic (4.5%, a difference of 0.31%).
| Demographics | Rating | Rank | Professional Degree |
| Immigrants | South America | 80.5 /100 | #144 | Excellent 4.6% |
| Uruguayans | 80.2 /100 | #145 | Excellent 4.6% |
| Luxembourgers | 78.7 /100 | #146 | Good 4.6% |
| Colombians | 77.7 /100 | #147 | Good 4.6% |
| Slovenes | 76.1 /100 | #148 | Good 4.6% |
| Senegalese | 75.3 /100 | #149 | Good 4.6% |
| Immigrants | Oceania | 73.4 /100 | #150 | Good 4.6% |
| Poles | 72.6 /100 | #151 | Good 4.6% |
| Immigrants | Africa | 72.5 /100 | #152 | Good 4.6% |
| Immigrants | Uruguay | 72.5 /100 | #153 | Good 4.6% |
| Scottish | 71.8 /100 | #154 | Good 4.6% |
| Slavs | 70.8 /100 | #155 | Good 4.5% |
| Swedes | 69.9 /100 | #156 | Good 4.5% |
| Iraqis | 69.8 /100 | #157 | Good 4.5% |
| Immigrants | Armenia | 68.8 /100 | #158 | Good 4.5% |