Guatemalan vs Polish Professional Degree
COMPARE
Guatemalan
Polish
Professional Degree
Professional Degree Comparison
Guatemalans
Poles
3.5%
PROFESSIONAL DEGREE
0.3/ 100
METRIC RATING
289th/ 347
METRIC RANK
4.6%
PROFESSIONAL DEGREE
72.6/ 100
METRIC RATING
151st/ 347
METRIC RANK
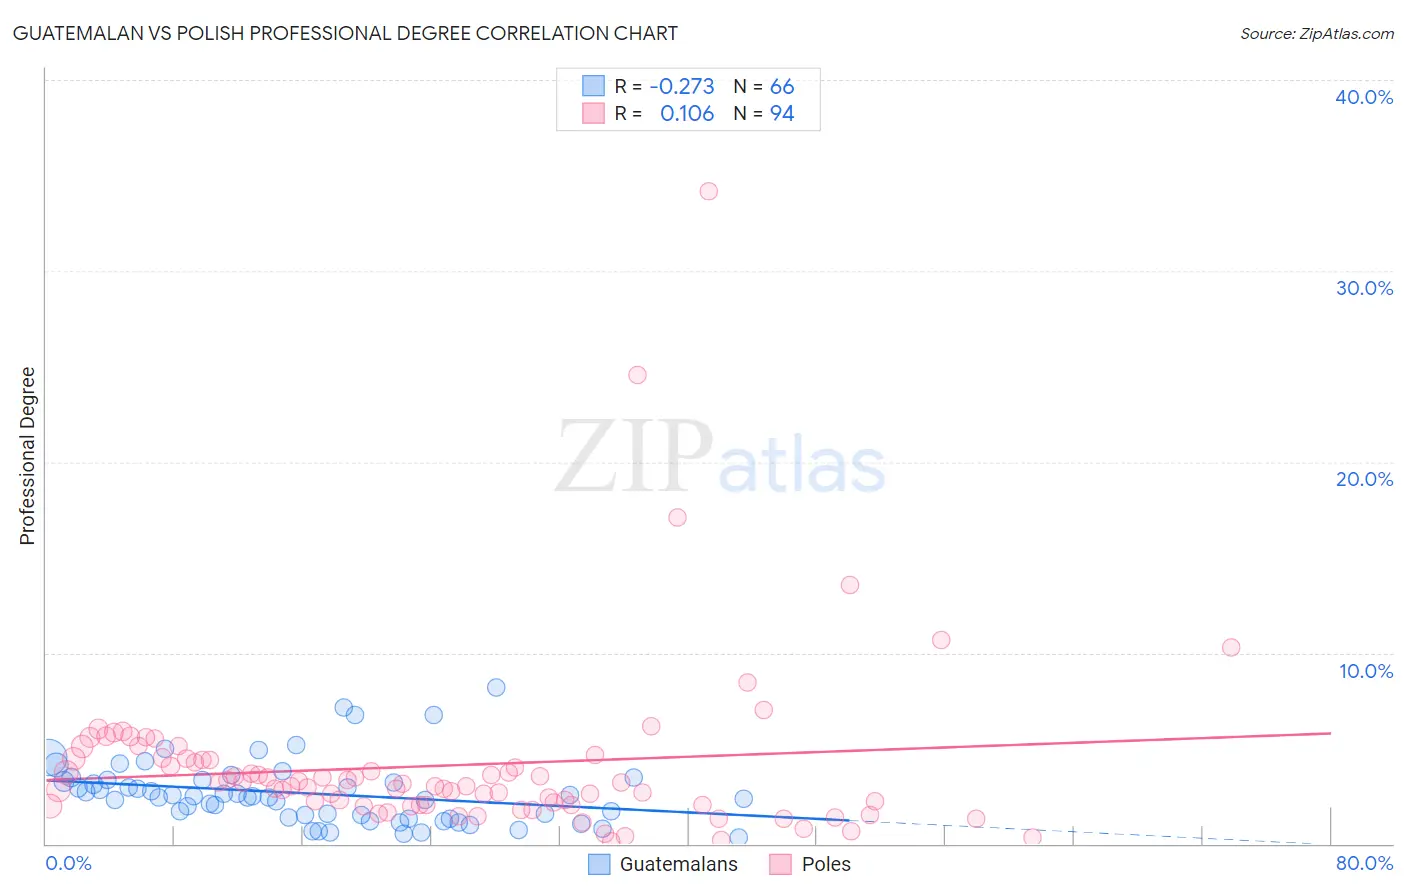
Guatemalan vs Polish Professional Degree Correlation Chart
The statistical analysis conducted on geographies consisting of 408,165,670 people shows a weak negative correlation between the proportion of Guatemalans and percentage of population with at least professional degree education in the United States with a correlation coefficient (R) of -0.273 and weighted average of 3.5%. Similarly, the statistical analysis conducted on geographies consisting of 553,734,682 people shows a poor positive correlation between the proportion of Poles and percentage of population with at least professional degree education in the United States with a correlation coefficient (R) of 0.106 and weighted average of 4.6%, a difference of 31.5%.
Professional Degree Correlation Summary
| Measurement | Guatemalan | Polish |
| Minimum | 0.34% | 0.12% |
| Maximum | 8.2% | 34.2% |
| Range | 7.8% | 34.0% |
| Mean | 2.6% | 4.1% |
| Median | 2.5% | 3.1% |
| Interquartile 25% (IQ1) | 1.4% | 2.0% |
| Interquartile 75% (IQ3) | 3.3% | 4.4% |
| Interquartile Range (IQR) | 1.9% | 2.4% |
| Standard Deviation (Sample) | 1.7% | 4.6% |
| Standard Deviation (Population) | 1.7% | 4.6% |
Similar Demographics by Professional Degree
Demographics Similar to Guatemalans by Professional Degree
In terms of professional degree, the demographic groups most similar to Guatemalans are Chippewa (3.5%, a difference of 0.010%), Blackfeet (3.5%, a difference of 0.17%), Alaska Native (3.5%, a difference of 0.18%), Immigrants from El Salvador (3.5%, a difference of 0.22%), and Immigrants from Belize (3.5%, a difference of 0.25%).
| Demographics | Rating | Rank | Professional Degree |
| Immigrants | Caribbean | 0.5 /100 | #282 | Tragic 3.5% |
| Comanche | 0.4 /100 | #283 | Tragic 3.5% |
| Salvadorans | 0.4 /100 | #284 | Tragic 3.5% |
| Hondurans | 0.3 /100 | #285 | Tragic 3.5% |
| Haitians | 0.3 /100 | #286 | Tragic 3.5% |
| Immigrants | El Salvador | 0.3 /100 | #287 | Tragic 3.5% |
| Blackfeet | 0.3 /100 | #288 | Tragic 3.5% |
| Guatemalans | 0.3 /100 | #289 | Tragic 3.5% |
| Chippewa | 0.3 /100 | #290 | Tragic 3.5% |
| Alaska Natives | 0.3 /100 | #291 | Tragic 3.5% |
| Immigrants | Belize | 0.3 /100 | #292 | Tragic 3.5% |
| Immigrants | Honduras | 0.3 /100 | #293 | Tragic 3.5% |
| Paiute | 0.3 /100 | #294 | Tragic 3.4% |
| Immigrants | Guatemala | 0.2 /100 | #295 | Tragic 3.4% |
| Hawaiians | 0.2 /100 | #296 | Tragic 3.4% |
Demographics Similar to Poles by Professional Degree
In terms of professional degree, the demographic groups most similar to Poles are Immigrants from Africa (4.6%, a difference of 0.010%), Immigrants from Uruguay (4.6%, a difference of 0.020%), Immigrants from Oceania (4.6%, a difference of 0.14%), Scottish (4.6%, a difference of 0.14%), and Slavic (4.5%, a difference of 0.31%).
| Demographics | Rating | Rank | Professional Degree |
| Immigrants | South America | 80.5 /100 | #144 | Excellent 4.6% |
| Uruguayans | 80.2 /100 | #145 | Excellent 4.6% |
| Luxembourgers | 78.7 /100 | #146 | Good 4.6% |
| Colombians | 77.7 /100 | #147 | Good 4.6% |
| Slovenes | 76.1 /100 | #148 | Good 4.6% |
| Senegalese | 75.3 /100 | #149 | Good 4.6% |
| Immigrants | Oceania | 73.4 /100 | #150 | Good 4.6% |
| Poles | 72.6 /100 | #151 | Good 4.6% |
| Immigrants | Africa | 72.5 /100 | #152 | Good 4.6% |
| Immigrants | Uruguay | 72.5 /100 | #153 | Good 4.6% |
| Scottish | 71.8 /100 | #154 | Good 4.6% |
| Slavs | 70.8 /100 | #155 | Good 4.5% |
| Swedes | 69.9 /100 | #156 | Good 4.5% |
| Iraqis | 69.8 /100 | #157 | Good 4.5% |
| Immigrants | Armenia | 68.8 /100 | #158 | Good 4.5% |