Indonesian vs Iroquois 10th Grade
COMPARE
Indonesian
Iroquois
10th Grade
10th Grade Comparison
Indonesians
Iroquois
91.8%
10TH GRADE
0.0/ 100
METRIC RATING
293rd/ 347
METRIC RANK
94.3%
10TH GRADE
92.8/ 100
METRIC RATING
129th/ 347
METRIC RANK
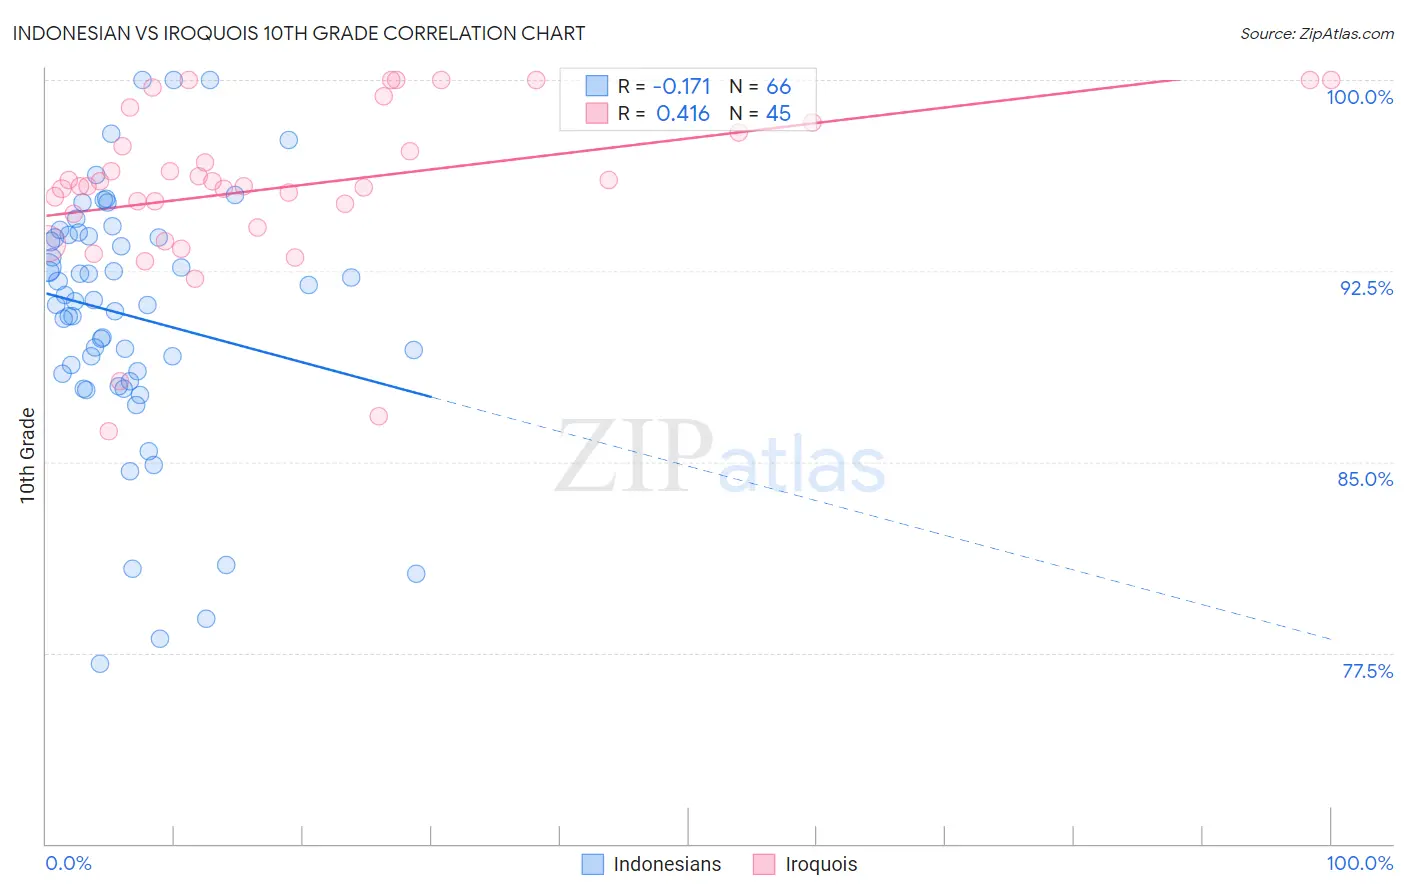
Indonesian vs Iroquois 10th Grade Correlation Chart
The statistical analysis conducted on geographies consisting of 162,727,113 people shows a poor negative correlation between the proportion of Indonesians and percentage of population with at least 10th grade education in the United States with a correlation coefficient (R) of -0.171 and weighted average of 91.8%. Similarly, the statistical analysis conducted on geographies consisting of 207,308,712 people shows a moderate positive correlation between the proportion of Iroquois and percentage of population with at least 10th grade education in the United States with a correlation coefficient (R) of 0.416 and weighted average of 94.3%, a difference of 2.7%.
10th Grade Correlation Summary
| Measurement | Indonesian | Iroquois |
| Minimum | 77.1% | 86.2% |
| Maximum | 100.0% | 100.0% |
| Range | 22.9% | 13.8% |
| Mean | 90.7% | 95.8% |
| Median | 91.3% | 95.8% |
| Interquartile 25% (IQ1) | 88.5% | 94.5% |
| Interquartile 75% (IQ3) | 93.9% | 98.1% |
| Interquartile Range (IQR) | 5.4% | 3.6% |
| Standard Deviation (Sample) | 5.0% | 3.3% |
| Standard Deviation (Population) | 4.9% | 3.2% |
Similar Demographics by 10th Grade
Demographics Similar to Indonesians by 10th Grade
In terms of 10th grade, the demographic groups most similar to Indonesians are Immigrants from West Indies (91.8%, a difference of 0.020%), Immigrants from Burma/Myanmar (91.8%, a difference of 0.020%), British West Indian (91.8%, a difference of 0.030%), Haitian (91.8%, a difference of 0.030%), and Sri Lankan (91.8%, a difference of 0.050%).
| Demographics | Rating | Rank | 10th Grade |
| Yuman | 0.0 /100 | #286 | Tragic 92.0% |
| Pennsylvania Germans | 0.0 /100 | #287 | Tragic 91.9% |
| Immigrants | Laos | 0.0 /100 | #288 | Tragic 91.9% |
| Sri Lankans | 0.0 /100 | #289 | Tragic 91.8% |
| British West Indians | 0.0 /100 | #290 | Tragic 91.8% |
| Immigrants | West Indies | 0.0 /100 | #291 | Tragic 91.8% |
| Immigrants | Burma/Myanmar | 0.0 /100 | #292 | Tragic 91.8% |
| Indonesians | 0.0 /100 | #293 | Tragic 91.8% |
| Haitians | 0.0 /100 | #294 | Tragic 91.8% |
| Lumbee | 0.0 /100 | #295 | Tragic 91.7% |
| Immigrants | Grenada | 0.0 /100 | #296 | Tragic 91.6% |
| Fijians | 0.0 /100 | #297 | Tragic 91.5% |
| Cubans | 0.0 /100 | #298 | Tragic 91.5% |
| Immigrants | Haiti | 0.0 /100 | #299 | Tragic 91.4% |
| Guyanese | 0.0 /100 | #300 | Tragic 91.4% |
Demographics Similar to Iroquois by 10th Grade
In terms of 10th grade, the demographic groups most similar to Iroquois are Immigrants from Greece (94.3%, a difference of 0.0%), Immigrants from Eastern Europe (94.3%, a difference of 0.010%), Immigrants from Russia (94.3%, a difference of 0.010%), Potawatomi (94.3%, a difference of 0.030%), and Creek (94.2%, a difference of 0.030%).
| Demographics | Rating | Rank | 10th Grade |
| Inupiat | 95.1 /100 | #122 | Exceptional 94.4% |
| Cree | 95.1 /100 | #123 | Exceptional 94.4% |
| Basques | 94.9 /100 | #124 | Exceptional 94.3% |
| Americans | 94.4 /100 | #125 | Exceptional 94.3% |
| Immigrants | Iran | 94.4 /100 | #126 | Exceptional 94.3% |
| Israelis | 93.8 /100 | #127 | Exceptional 94.3% |
| Potawatomi | 93.6 /100 | #128 | Exceptional 94.3% |
| Iroquois | 92.8 /100 | #129 | Exceptional 94.3% |
| Immigrants | Greece | 92.7 /100 | #130 | Exceptional 94.3% |
| Immigrants | Eastern Europe | 92.5 /100 | #131 | Exceptional 94.3% |
| Immigrants | Russia | 92.4 /100 | #132 | Exceptional 94.3% |
| Creek | 91.9 /100 | #133 | Exceptional 94.2% |
| Osage | 91.7 /100 | #134 | Exceptional 94.2% |
| Immigrants | Korea | 91.3 /100 | #135 | Exceptional 94.2% |
| Shoshone | 90.8 /100 | #136 | Exceptional 94.2% |