Immigrants from Cuba vs Comanche Professional Degree
COMPARE
Immigrants from Cuba
Comanche
Professional Degree
Professional Degree Comparison
Immigrants from Cuba
Comanche
3.6%
PROFESSIONAL DEGREE
0.6/ 100
METRIC RATING
269th/ 347
METRIC RANK
3.5%
PROFESSIONAL DEGREE
0.4/ 100
METRIC RATING
283rd/ 347
METRIC RANK
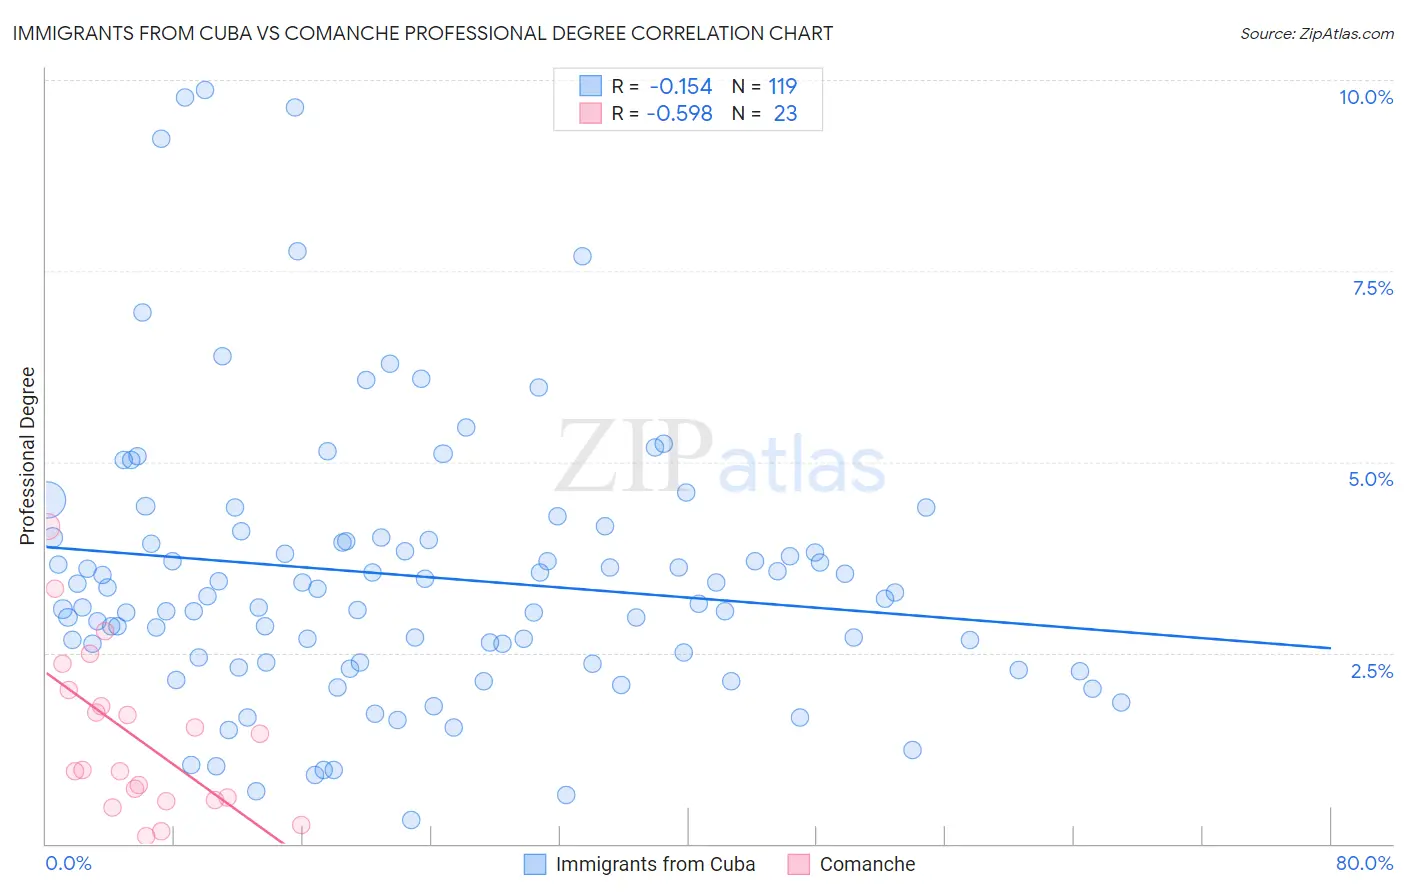
Immigrants from Cuba vs Comanche Professional Degree Correlation Chart
The statistical analysis conducted on geographies consisting of 325,367,242 people shows a poor negative correlation between the proportion of Immigrants from Cuba and percentage of population with at least professional degree education in the United States with a correlation coefficient (R) of -0.154 and weighted average of 3.6%. Similarly, the statistical analysis conducted on geographies consisting of 109,559,847 people shows a substantial negative correlation between the proportion of Comanche and percentage of population with at least professional degree education in the United States with a correlation coefficient (R) of -0.598 and weighted average of 3.5%, a difference of 1.8%.
Professional Degree Correlation Summary
| Measurement | Immigrants from Cuba | Comanche |
| Minimum | 0.31% | 0.11% |
| Maximum | 9.9% | 4.1% |
| Range | 9.6% | 4.0% |
| Mean | 3.5% | 1.4% |
| Median | 3.2% | 0.97% |
| Interquartile 25% (IQ1) | 2.4% | 0.57% |
| Interquartile 75% (IQ3) | 4.0% | 2.0% |
| Interquartile Range (IQR) | 1.6% | 1.4% |
| Standard Deviation (Sample) | 1.8% | 1.1% |
| Standard Deviation (Population) | 1.8% | 1.0% |
Demographics Similar to Immigrants from Cuba and Comanche by Professional Degree
In terms of professional degree, the demographic groups most similar to Immigrants from Cuba are Central American (3.6%, a difference of 0.29%), Aleut (3.6%, a difference of 0.60%), Delaware (3.6%, a difference of 0.75%), Belizean (3.6%, a difference of 0.76%), and Immigrants from Jamaica (3.6%, a difference of 0.78%). Similarly, the demographic groups most similar to Comanche are Salvadoran (3.5%, a difference of 0.10%), Immigrants from Caribbean (3.5%, a difference of 0.30%), Apache (3.5%, a difference of 0.32%), Dominican (3.5%, a difference of 0.34%), and Immigrants from Portugal (3.5%, a difference of 0.38%).
| Demographics | Rating | Rank | Professional Degree |
| Central American Indians | 0.8 /100 | #266 | Tragic 3.6% |
| Delaware | 0.7 /100 | #267 | Tragic 3.6% |
| Aleuts | 0.7 /100 | #268 | Tragic 3.6% |
| Immigrants | Cuba | 0.6 /100 | #269 | Tragic 3.6% |
| Central Americans | 0.6 /100 | #270 | Tragic 3.6% |
| Belizeans | 0.5 /100 | #271 | Tragic 3.6% |
| Immigrants | Jamaica | 0.5 /100 | #272 | Tragic 3.6% |
| Americans | 0.5 /100 | #273 | Tragic 3.6% |
| Potawatomi | 0.5 /100 | #274 | Tragic 3.6% |
| Immigrants | Dominica | 0.5 /100 | #275 | Tragic 3.6% |
| Liberians | 0.5 /100 | #276 | Tragic 3.6% |
| Cheyenne | 0.5 /100 | #277 | Tragic 3.6% |
| Japanese | 0.5 /100 | #278 | Tragic 3.5% |
| Immigrants | Portugal | 0.5 /100 | #279 | Tragic 3.5% |
| Dominicans | 0.5 /100 | #280 | Tragic 3.5% |
| Apache | 0.5 /100 | #281 | Tragic 3.5% |
| Immigrants | Caribbean | 0.5 /100 | #282 | Tragic 3.5% |
| Comanche | 0.4 /100 | #283 | Tragic 3.5% |
| Salvadorans | 0.4 /100 | #284 | Tragic 3.5% |
| Hondurans | 0.3 /100 | #285 | Tragic 3.5% |
| Haitians | 0.3 /100 | #286 | Tragic 3.5% |