Finnish vs Comanche Professional Degree
COMPARE
Finnish
Comanche
Professional Degree
Professional Degree Comparison
Finns
Comanche
4.2%
PROFESSIONAL DEGREE
18.7/ 100
METRIC RATING
201st/ 347
METRIC RANK
3.5%
PROFESSIONAL DEGREE
0.4/ 100
METRIC RATING
283rd/ 347
METRIC RANK
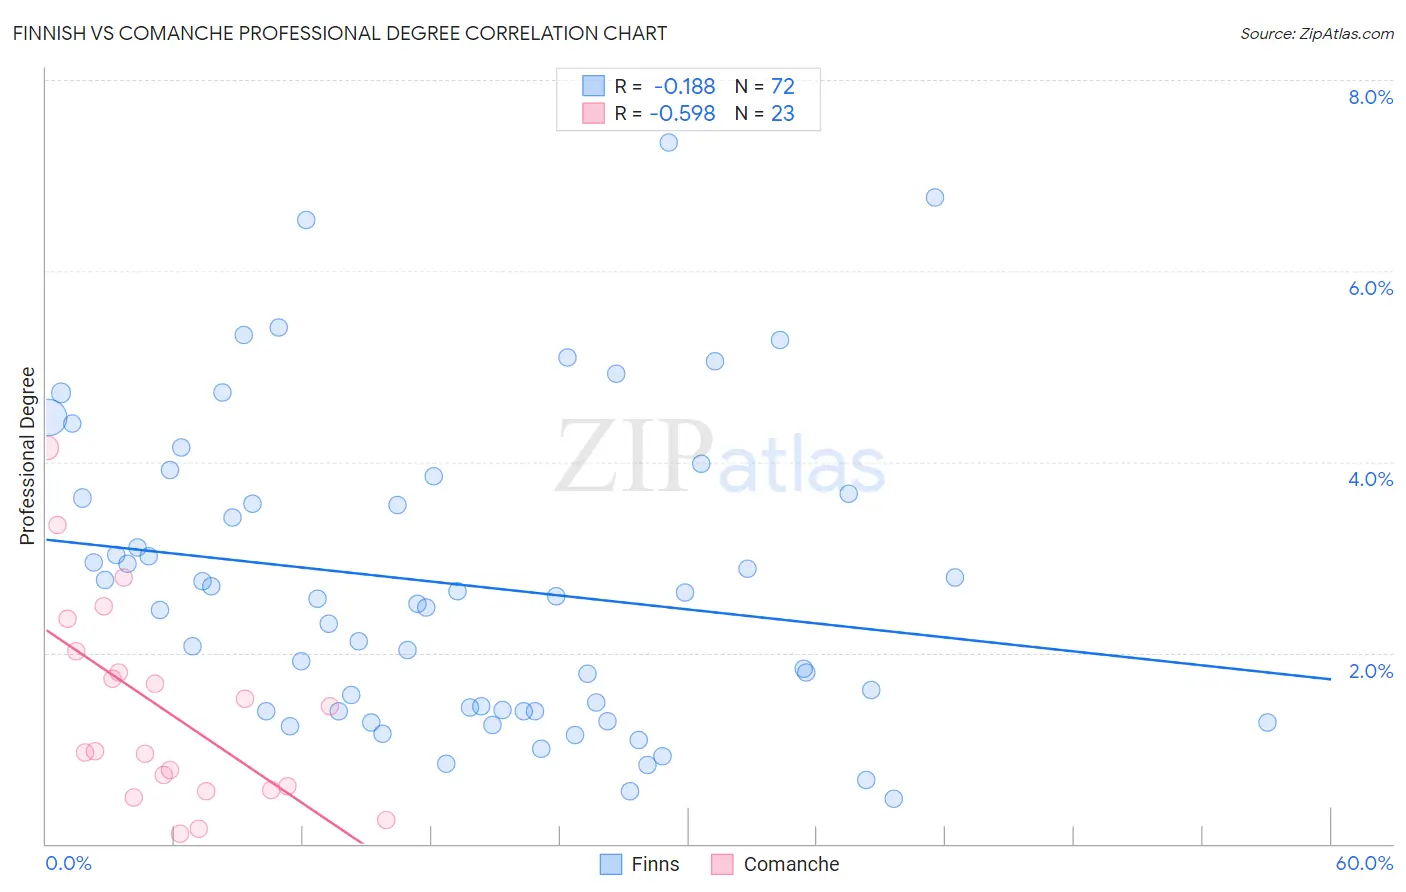
Finnish vs Comanche Professional Degree Correlation Chart
The statistical analysis conducted on geographies consisting of 403,408,940 people shows a poor negative correlation between the proportion of Finns and percentage of population with at least professional degree education in the United States with a correlation coefficient (R) of -0.188 and weighted average of 4.2%. Similarly, the statistical analysis conducted on geographies consisting of 109,559,847 people shows a substantial negative correlation between the proportion of Comanche and percentage of population with at least professional degree education in the United States with a correlation coefficient (R) of -0.598 and weighted average of 3.5%, a difference of 18.1%.
Professional Degree Correlation Summary
| Measurement | Finnish | Comanche |
| Minimum | 0.47% | 0.11% |
| Maximum | 7.3% | 4.1% |
| Range | 6.9% | 4.0% |
| Mean | 2.7% | 1.4% |
| Median | 2.5% | 0.97% |
| Interquartile 25% (IQ1) | 1.4% | 0.57% |
| Interquartile 75% (IQ3) | 3.6% | 2.0% |
| Interquartile Range (IQR) | 2.3% | 1.4% |
| Standard Deviation (Sample) | 1.6% | 1.1% |
| Standard Deviation (Population) | 1.6% | 1.0% |
Similar Demographics by Professional Degree
Demographics Similar to Finns by Professional Degree
In terms of professional degree, the demographic groups most similar to Finns are Immigrants from North Macedonia (4.2%, a difference of 0.36%), Immigrants from Iraq (4.2%, a difference of 0.43%), Norwegian (4.2%, a difference of 0.44%), Panamanian (4.1%, a difference of 0.76%), and Barbadian (4.1%, a difference of 0.79%).
| Demographics | Rating | Rank | Professional Degree |
| Scandinavians | 25.8 /100 | #194 | Fair 4.2% |
| Nigerians | 24.6 /100 | #195 | Fair 4.2% |
| Spanish | 23.0 /100 | #196 | Fair 4.2% |
| Czechoslovakians | 22.4 /100 | #197 | Fair 4.2% |
| Immigrants | Middle Africa | 22.1 /100 | #198 | Fair 4.2% |
| Norwegians | 20.5 /100 | #199 | Fair 4.2% |
| Immigrants | North Macedonia | 20.2 /100 | #200 | Fair 4.2% |
| Finns | 18.7 /100 | #201 | Poor 4.2% |
| Immigrants | Iraq | 17.1 /100 | #202 | Poor 4.2% |
| Panamanians | 15.9 /100 | #203 | Poor 4.1% |
| Barbadians | 15.8 /100 | #204 | Poor 4.1% |
| Somalis | 14.8 /100 | #205 | Poor 4.1% |
| Yugoslavians | 13.4 /100 | #206 | Poor 4.1% |
| Sub-Saharan Africans | 12.8 /100 | #207 | Poor 4.1% |
| Immigrants | Somalia | 12.5 /100 | #208 | Poor 4.1% |
Demographics Similar to Comanche by Professional Degree
In terms of professional degree, the demographic groups most similar to Comanche are Salvadoran (3.5%, a difference of 0.10%), Immigrants from Caribbean (3.5%, a difference of 0.30%), Apache (3.5%, a difference of 0.32%), Dominican (3.5%, a difference of 0.34%), and Immigrants from Portugal (3.5%, a difference of 0.38%).
| Demographics | Rating | Rank | Professional Degree |
| Liberians | 0.5 /100 | #276 | Tragic 3.6% |
| Cheyenne | 0.5 /100 | #277 | Tragic 3.6% |
| Japanese | 0.5 /100 | #278 | Tragic 3.5% |
| Immigrants | Portugal | 0.5 /100 | #279 | Tragic 3.5% |
| Dominicans | 0.5 /100 | #280 | Tragic 3.5% |
| Apache | 0.5 /100 | #281 | Tragic 3.5% |
| Immigrants | Caribbean | 0.5 /100 | #282 | Tragic 3.5% |
| Comanche | 0.4 /100 | #283 | Tragic 3.5% |
| Salvadorans | 0.4 /100 | #284 | Tragic 3.5% |
| Hondurans | 0.3 /100 | #285 | Tragic 3.5% |
| Haitians | 0.3 /100 | #286 | Tragic 3.5% |
| Immigrants | El Salvador | 0.3 /100 | #287 | Tragic 3.5% |
| Blackfeet | 0.3 /100 | #288 | Tragic 3.5% |
| Guatemalans | 0.3 /100 | #289 | Tragic 3.5% |
| Chippewa | 0.3 /100 | #290 | Tragic 3.5% |