Indian (Asian) vs Spanish American Indian 9th Grade
COMPARE
Indian (Asian)
Spanish American Indian
9th Grade
9th Grade Comparison
Indians (Asian)
Spanish American Indians
94.5%
9TH GRADE
8.6/ 100
METRIC RATING
220th/ 347
METRIC RANK
88.3%
9TH GRADE
0.0/ 100
METRIC RATING
347th/ 347
METRIC RANK
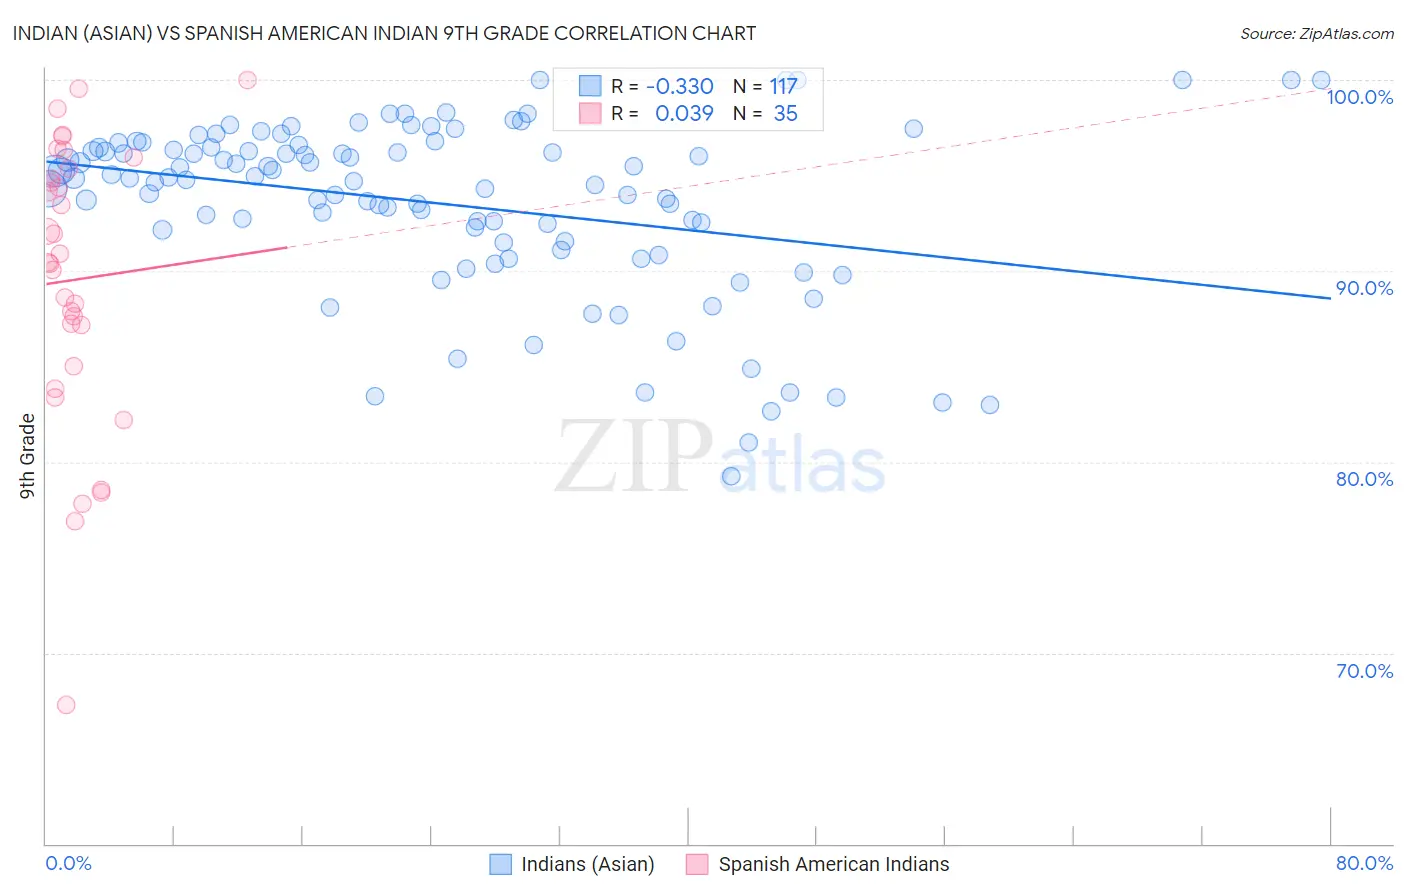
Indian (Asian) vs Spanish American Indian 9th Grade Correlation Chart
The statistical analysis conducted on geographies consisting of 495,348,182 people shows a mild negative correlation between the proportion of Indians (Asian) and percentage of population with at least 9th grade education in the United States with a correlation coefficient (R) of -0.330 and weighted average of 94.5%. Similarly, the statistical analysis conducted on geographies consisting of 73,150,359 people shows no correlation between the proportion of Spanish American Indians and percentage of population with at least 9th grade education in the United States with a correlation coefficient (R) of 0.039 and weighted average of 88.3%, a difference of 7.0%.
9th Grade Correlation Summary
| Measurement | Indian (Asian) | Spanish American Indian |
| Minimum | 79.3% | 67.2% |
| Maximum | 100.0% | 100.0% |
| Range | 20.7% | 32.8% |
| Mean | 93.5% | 89.5% |
| Median | 94.8% | 90.4% |
| Interquartile 25% (IQ1) | 91.5% | 85.0% |
| Interquartile 75% (IQ3) | 96.5% | 95.3% |
| Interquartile Range (IQR) | 5.0% | 10.3% |
| Standard Deviation (Sample) | 4.5% | 7.5% |
| Standard Deviation (Population) | 4.5% | 7.4% |
Similar Demographics by 9th Grade
Demographics Similar to Indians (Asian) by 9th Grade
In terms of 9th grade, the demographic groups most similar to Indians (Asian) are Portuguese (94.5%, a difference of 0.010%), African (94.5%, a difference of 0.010%), Immigrants from Eastern Africa (94.5%, a difference of 0.010%), Immigrants from Asia (94.4%, a difference of 0.020%), and Asian (94.5%, a difference of 0.030%).
| Demographics | Rating | Rank | 9th Grade |
| Immigrants | Oceania | 12.1 /100 | #213 | Poor 94.5% |
| Immigrants | Liberia | 11.8 /100 | #214 | Poor 94.5% |
| Immigrants | Syria | 11.0 /100 | #215 | Poor 94.5% |
| Immigrants | Western Asia | 10.7 /100 | #216 | Poor 94.5% |
| Asians | 9.9 /100 | #217 | Tragic 94.5% |
| Portuguese | 9.2 /100 | #218 | Tragic 94.5% |
| Africans | 9.0 /100 | #219 | Tragic 94.5% |
| Indians (Asian) | 8.6 /100 | #220 | Tragic 94.5% |
| Immigrants | Eastern Africa | 8.2 /100 | #221 | Tragic 94.5% |
| Immigrants | Asia | 7.7 /100 | #222 | Tragic 94.4% |
| Bahamians | 7.0 /100 | #223 | Tragic 94.4% |
| Tongans | 6.0 /100 | #224 | Tragic 94.4% |
| Ethiopians | 5.4 /100 | #225 | Tragic 94.4% |
| Sub-Saharan Africans | 5.4 /100 | #226 | Tragic 94.4% |
| Immigrants | Sierra Leone | 4.8 /100 | #227 | Tragic 94.4% |
Demographics Similar to Spanish American Indians by 9th Grade
In terms of 9th grade, the demographic groups most similar to Spanish American Indians are Immigrants from Mexico (88.7%, a difference of 0.43%), Immigrants from Central America (89.0%, a difference of 0.77%), Immigrants from El Salvador (89.0%, a difference of 0.79%), Immigrants from Guatemala (89.4%, a difference of 1.3%), and Salvadoran (89.6%, a difference of 1.5%).
| Demographics | Rating | Rank | 9th Grade |
| Immigrants | Yemen | 0.0 /100 | #333 | Tragic 90.8% |
| Immigrants | Azores | 0.0 /100 | #334 | Tragic 90.8% |
| Immigrants | Honduras | 0.0 /100 | #335 | Tragic 90.6% |
| Immigrants | Dominican Republic | 0.0 /100 | #336 | Tragic 90.5% |
| Immigrants | Latin America | 0.0 /100 | #337 | Tragic 90.4% |
| Central Americans | 0.0 /100 | #338 | Tragic 90.4% |
| Yakama | 0.0 /100 | #339 | Tragic 90.1% |
| Mexicans | 0.0 /100 | #340 | Tragic 90.0% |
| Guatemalans | 0.0 /100 | #341 | Tragic 89.9% |
| Salvadorans | 0.0 /100 | #342 | Tragic 89.6% |
| Immigrants | Guatemala | 0.0 /100 | #343 | Tragic 89.4% |
| Immigrants | El Salvador | 0.0 /100 | #344 | Tragic 89.0% |
| Immigrants | Central America | 0.0 /100 | #345 | Tragic 89.0% |
| Immigrants | Mexico | 0.0 /100 | #346 | Tragic 88.7% |
| Spanish American Indians | 0.0 /100 | #347 | Tragic 88.3% |