Indian (Asian) vs Immigrants from Nicaragua 9th Grade
COMPARE
Indian (Asian)
Immigrants from Nicaragua
9th Grade
9th Grade Comparison
Indians (Asian)
Immigrants from Nicaragua
94.5%
9TH GRADE
8.6/ 100
METRIC RATING
220th/ 347
METRIC RANK
91.3%
9TH GRADE
0.0/ 100
METRIC RATING
327th/ 347
METRIC RANK
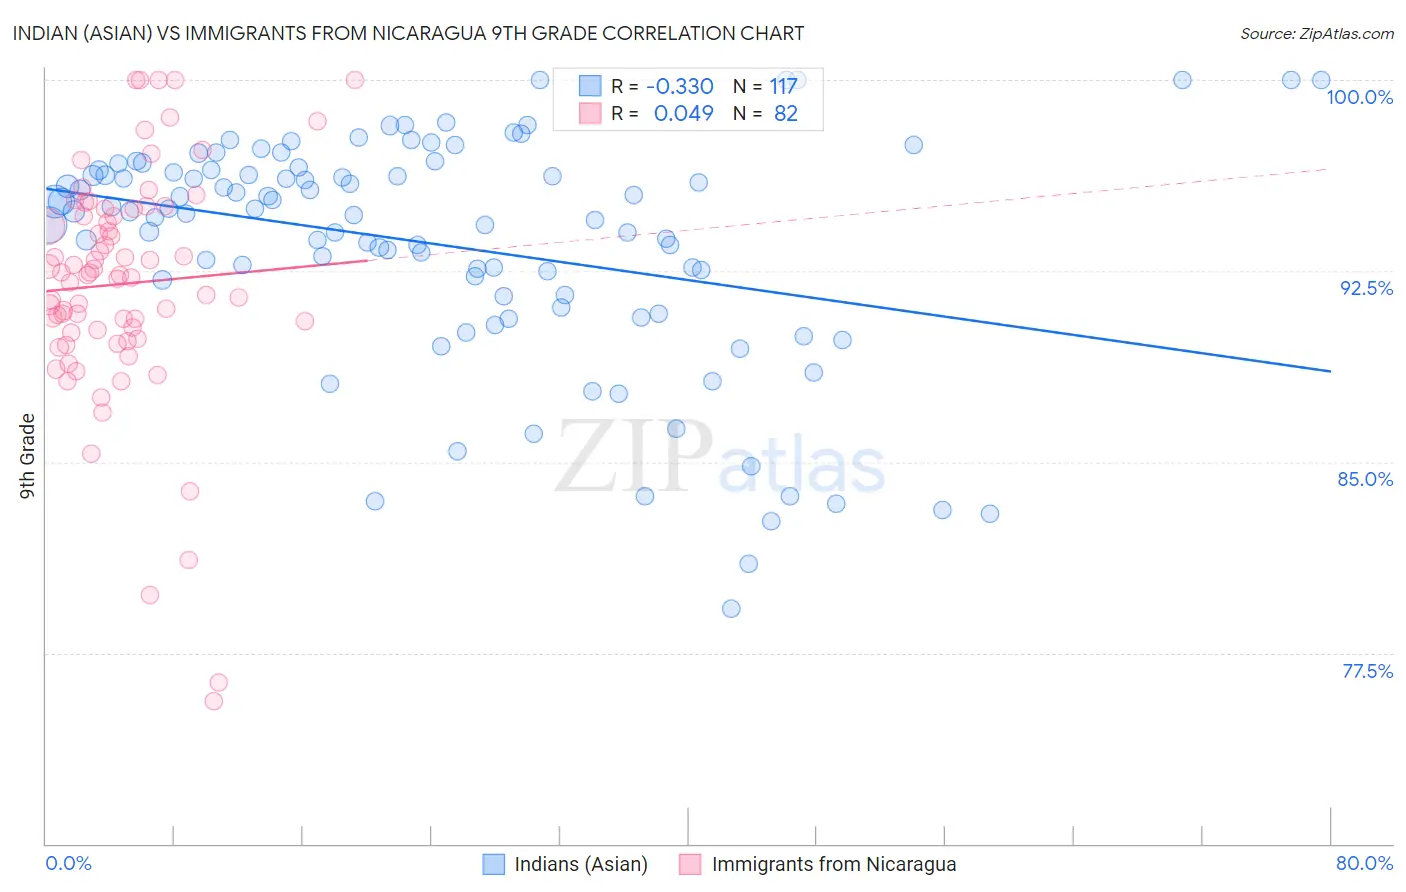
Indian (Asian) vs Immigrants from Nicaragua 9th Grade Correlation Chart
The statistical analysis conducted on geographies consisting of 495,348,182 people shows a mild negative correlation between the proportion of Indians (Asian) and percentage of population with at least 9th grade education in the United States with a correlation coefficient (R) of -0.330 and weighted average of 94.5%. Similarly, the statistical analysis conducted on geographies consisting of 236,340,506 people shows no correlation between the proportion of Immigrants from Nicaragua and percentage of population with at least 9th grade education in the United States with a correlation coefficient (R) of 0.049 and weighted average of 91.3%, a difference of 3.4%.
9th Grade Correlation Summary
| Measurement | Indian (Asian) | Immigrants from Nicaragua |
| Minimum | 79.3% | 75.6% |
| Maximum | 100.0% | 100.0% |
| Range | 20.7% | 24.4% |
| Mean | 93.5% | 92.0% |
| Median | 94.8% | 92.3% |
| Interquartile 25% (IQ1) | 91.5% | 90.1% |
| Interquartile 75% (IQ3) | 96.5% | 94.9% |
| Interquartile Range (IQR) | 5.0% | 4.8% |
| Standard Deviation (Sample) | 4.5% | 4.6% |
| Standard Deviation (Population) | 4.5% | 4.6% |
Similar Demographics by 9th Grade
Demographics Similar to Indians (Asian) by 9th Grade
In terms of 9th grade, the demographic groups most similar to Indians (Asian) are Portuguese (94.5%, a difference of 0.010%), African (94.5%, a difference of 0.010%), Immigrants from Eastern Africa (94.5%, a difference of 0.010%), Immigrants from Asia (94.4%, a difference of 0.020%), and Asian (94.5%, a difference of 0.030%).
| Demographics | Rating | Rank | 9th Grade |
| Immigrants | Oceania | 12.1 /100 | #213 | Poor 94.5% |
| Immigrants | Liberia | 11.8 /100 | #214 | Poor 94.5% |
| Immigrants | Syria | 11.0 /100 | #215 | Poor 94.5% |
| Immigrants | Western Asia | 10.7 /100 | #216 | Poor 94.5% |
| Asians | 9.9 /100 | #217 | Tragic 94.5% |
| Portuguese | 9.2 /100 | #218 | Tragic 94.5% |
| Africans | 9.0 /100 | #219 | Tragic 94.5% |
| Indians (Asian) | 8.6 /100 | #220 | Tragic 94.5% |
| Immigrants | Eastern Africa | 8.2 /100 | #221 | Tragic 94.5% |
| Immigrants | Asia | 7.7 /100 | #222 | Tragic 94.4% |
| Bahamians | 7.0 /100 | #223 | Tragic 94.4% |
| Tongans | 6.0 /100 | #224 | Tragic 94.4% |
| Ethiopians | 5.4 /100 | #225 | Tragic 94.4% |
| Sub-Saharan Africans | 5.4 /100 | #226 | Tragic 94.4% |
| Immigrants | Sierra Leone | 4.8 /100 | #227 | Tragic 94.4% |
Demographics Similar to Immigrants from Nicaragua by 9th Grade
In terms of 9th grade, the demographic groups most similar to Immigrants from Nicaragua are Immigrants from Armenia (91.4%, a difference of 0.050%), Central American Indian (91.5%, a difference of 0.15%), Dominican (91.1%, a difference of 0.30%), Honduran (91.0%, a difference of 0.32%), and Immigrants from Cabo Verde (90.9%, a difference of 0.45%).
| Demographics | Rating | Rank | 9th Grade |
| Nicaraguans | 0.0 /100 | #320 | Tragic 91.9% |
| Immigrants | Ecuador | 0.0 /100 | #321 | Tragic 91.8% |
| Belizeans | 0.0 /100 | #322 | Tragic 91.8% |
| Puerto Ricans | 0.0 /100 | #323 | Tragic 91.8% |
| Immigrants | Belize | 0.0 /100 | #324 | Tragic 91.8% |
| Central American Indians | 0.0 /100 | #325 | Tragic 91.5% |
| Immigrants | Armenia | 0.0 /100 | #326 | Tragic 91.4% |
| Immigrants | Nicaragua | 0.0 /100 | #327 | Tragic 91.3% |
| Dominicans | 0.0 /100 | #328 | Tragic 91.1% |
| Hondurans | 0.0 /100 | #329 | Tragic 91.0% |
| Immigrants | Cabo Verde | 0.0 /100 | #330 | Tragic 90.9% |
| Mexican American Indians | 0.0 /100 | #331 | Tragic 90.9% |
| Hispanics or Latinos | 0.0 /100 | #332 | Tragic 90.9% |
| Immigrants | Yemen | 0.0 /100 | #333 | Tragic 90.8% |
| Immigrants | Azores | 0.0 /100 | #334 | Tragic 90.8% |