Cuban vs Spanish American Indian 9th Grade
COMPARE
Cuban
Spanish American Indian
9th Grade
9th Grade Comparison
Cubans
Spanish American Indians
93.2%
9TH GRADE
0.0/ 100
METRIC RATING
294th/ 347
METRIC RANK
88.3%
9TH GRADE
0.0/ 100
METRIC RATING
347th/ 347
METRIC RANK
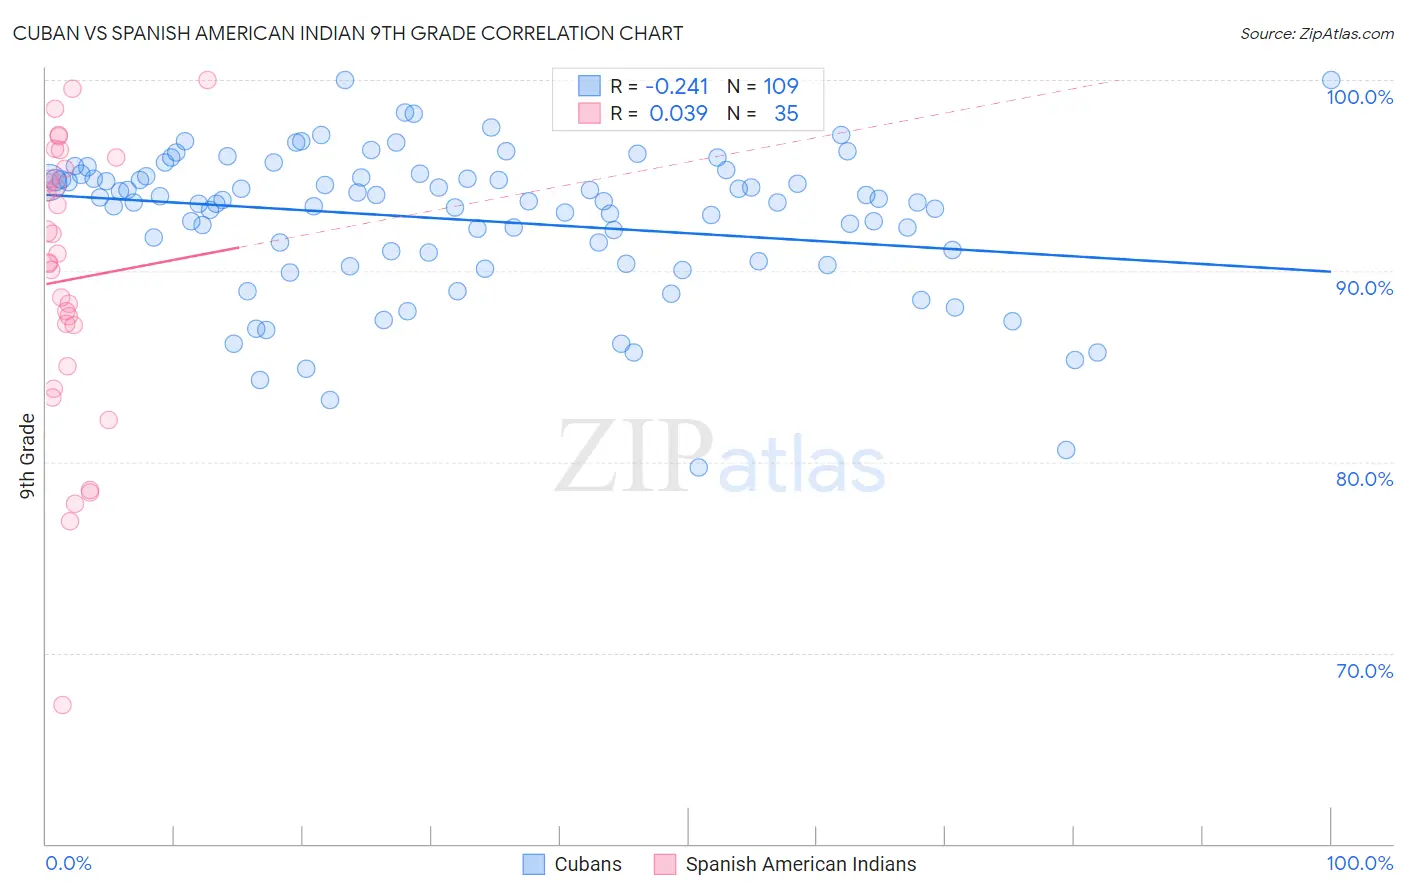
Cuban vs Spanish American Indian 9th Grade Correlation Chart
The statistical analysis conducted on geographies consisting of 449,368,946 people shows a weak negative correlation between the proportion of Cubans and percentage of population with at least 9th grade education in the United States with a correlation coefficient (R) of -0.241 and weighted average of 93.2%. Similarly, the statistical analysis conducted on geographies consisting of 73,150,359 people shows no correlation between the proportion of Spanish American Indians and percentage of population with at least 9th grade education in the United States with a correlation coefficient (R) of 0.039 and weighted average of 88.3%, a difference of 5.5%.
9th Grade Correlation Summary
| Measurement | Cuban | Spanish American Indian |
| Minimum | 79.7% | 67.2% |
| Maximum | 100.0% | 100.0% |
| Range | 20.3% | 32.8% |
| Mean | 92.7% | 89.5% |
| Median | 93.6% | 90.4% |
| Interquartile 25% (IQ1) | 90.7% | 85.0% |
| Interquartile 75% (IQ3) | 94.9% | 95.3% |
| Interquartile Range (IQR) | 4.2% | 10.3% |
| Standard Deviation (Sample) | 3.8% | 7.5% |
| Standard Deviation (Population) | 3.8% | 7.4% |
Similar Demographics by 9th Grade
Demographics Similar to Cubans by 9th Grade
In terms of 9th grade, the demographic groups most similar to Cubans are Sri Lankan (93.2%, a difference of 0.0%), Immigrants from Laos (93.2%, a difference of 0.020%), Immigrants from Burma/Myanmar (93.1%, a difference of 0.020%), Indonesian (93.1%, a difference of 0.020%), and British West Indian (93.2%, a difference of 0.030%).
| Demographics | Rating | Rank | 9th Grade |
| Immigrants | St. Vincent and the Grenadines | 0.0 /100 | #287 | Tragic 93.4% |
| Immigrants | South Eastern Asia | 0.0 /100 | #288 | Tragic 93.3% |
| Immigrants | West Indies | 0.0 /100 | #289 | Tragic 93.3% |
| Pennsylvania Germans | 0.0 /100 | #290 | Tragic 93.3% |
| British West Indians | 0.0 /100 | #291 | Tragic 93.2% |
| Immigrants | Laos | 0.0 /100 | #292 | Tragic 93.2% |
| Sri Lankans | 0.0 /100 | #293 | Tragic 93.2% |
| Cubans | 0.0 /100 | #294 | Tragic 93.2% |
| Immigrants | Burma/Myanmar | 0.0 /100 | #295 | Tragic 93.1% |
| Indonesians | 0.0 /100 | #296 | Tragic 93.1% |
| Fijians | 0.0 /100 | #297 | Tragic 93.1% |
| Haitians | 0.0 /100 | #298 | Tragic 93.1% |
| Immigrants | Grenada | 0.0 /100 | #299 | Tragic 93.0% |
| Yaqui | 0.0 /100 | #300 | Tragic 92.9% |
| Immigrants | Haiti | 0.0 /100 | #301 | Tragic 92.7% |
Demographics Similar to Spanish American Indians by 9th Grade
In terms of 9th grade, the demographic groups most similar to Spanish American Indians are Immigrants from Mexico (88.7%, a difference of 0.43%), Immigrants from Central America (89.0%, a difference of 0.77%), Immigrants from El Salvador (89.0%, a difference of 0.79%), Immigrants from Guatemala (89.4%, a difference of 1.3%), and Salvadoran (89.6%, a difference of 1.5%).
| Demographics | Rating | Rank | 9th Grade |
| Immigrants | Yemen | 0.0 /100 | #333 | Tragic 90.8% |
| Immigrants | Azores | 0.0 /100 | #334 | Tragic 90.8% |
| Immigrants | Honduras | 0.0 /100 | #335 | Tragic 90.6% |
| Immigrants | Dominican Republic | 0.0 /100 | #336 | Tragic 90.5% |
| Immigrants | Latin America | 0.0 /100 | #337 | Tragic 90.4% |
| Central Americans | 0.0 /100 | #338 | Tragic 90.4% |
| Yakama | 0.0 /100 | #339 | Tragic 90.1% |
| Mexicans | 0.0 /100 | #340 | Tragic 90.0% |
| Guatemalans | 0.0 /100 | #341 | Tragic 89.9% |
| Salvadorans | 0.0 /100 | #342 | Tragic 89.6% |
| Immigrants | Guatemala | 0.0 /100 | #343 | Tragic 89.4% |
| Immigrants | El Salvador | 0.0 /100 | #344 | Tragic 89.0% |
| Immigrants | Central America | 0.0 /100 | #345 | Tragic 89.0% |
| Immigrants | Mexico | 0.0 /100 | #346 | Tragic 88.7% |
| Spanish American Indians | 0.0 /100 | #347 | Tragic 88.3% |