Indian (Asian) vs Spanish American Indian Unemployment Among Seniors over 75 years
COMPARE
Indian (Asian)
Spanish American Indian
Unemployment Among Seniors over 75 years
Unemployment Among Seniors over 75 years Comparison
Indians (Asian)
Spanish American Indians
8.0%
UNEMPLOYMENT AMONG SENIORS OVER 75 YEARS
99.9/ 100
METRIC RATING
69th/ 347
METRIC RANK
6.5%
UNEMPLOYMENT AMONG SENIORS OVER 75 YEARS
100.0/ 100
METRIC RATING
7th/ 347
METRIC RANK
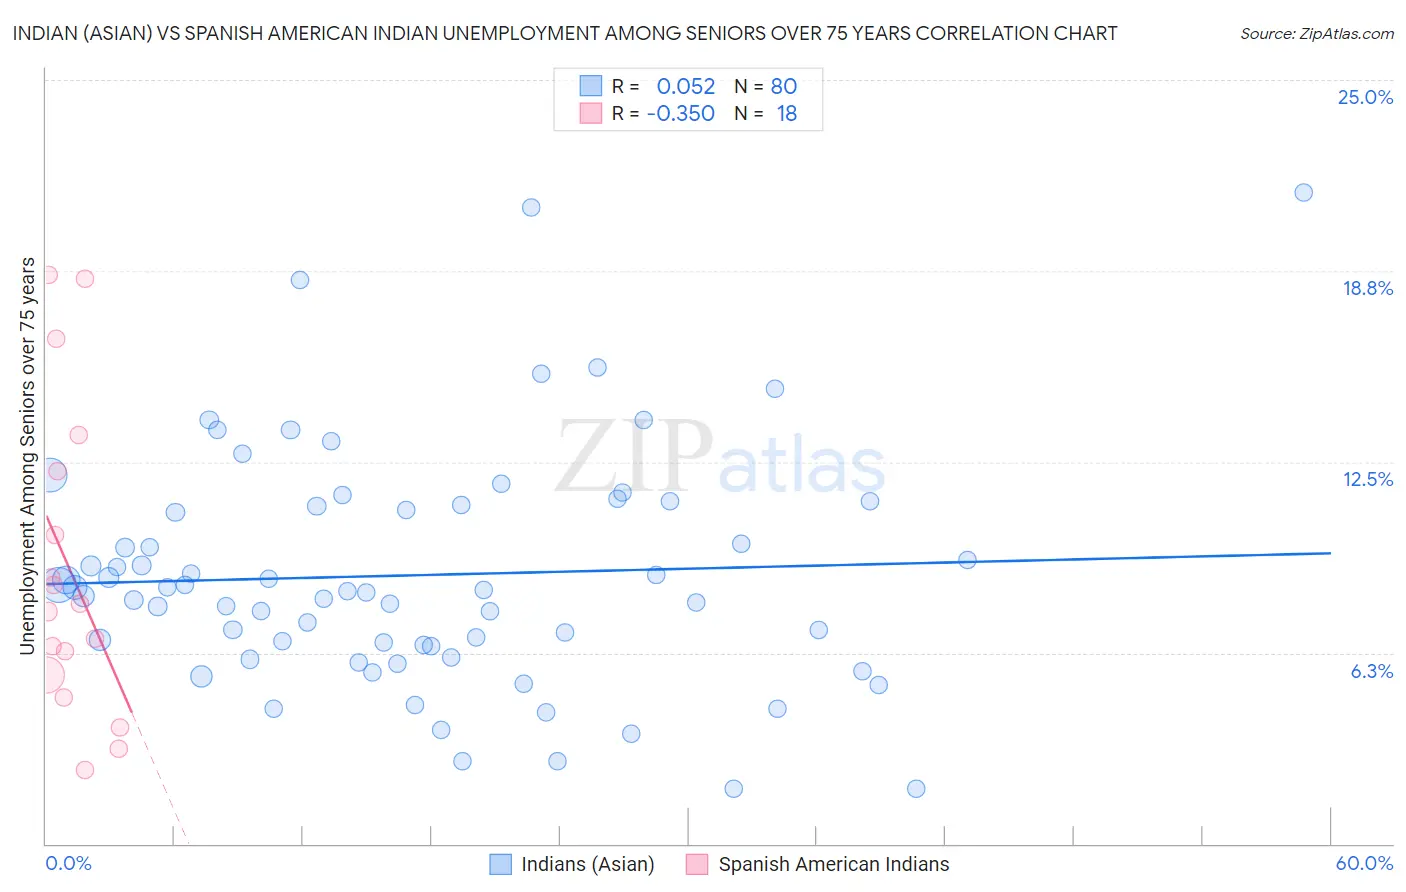
Indian (Asian) vs Spanish American Indian Unemployment Among Seniors over 75 years Correlation Chart
The statistical analysis conducted on geographies consisting of 226,406,777 people shows a slight positive correlation between the proportion of Indians (Asian) and unemployment rate among seniors over the age of 75 in the United States with a correlation coefficient (R) of 0.052 and weighted average of 8.0%. Similarly, the statistical analysis conducted on geographies consisting of 58,085,888 people shows a mild negative correlation between the proportion of Spanish American Indians and unemployment rate among seniors over the age of 75 in the United States with a correlation coefficient (R) of -0.350 and weighted average of 6.5%, a difference of 21.8%.
Unemployment Among Seniors over 75 years Correlation Summary
| Measurement | Indian (Asian) | Spanish American Indian |
| Minimum | 1.8% | 2.4% |
| Maximum | 21.3% | 18.6% |
| Range | 19.5% | 16.2% |
| Mean | 8.8% | 9.0% |
| Median | 8.3% | 7.7% |
| Interquartile 25% (IQ1) | 6.5% | 5.5% |
| Interquartile 75% (IQ3) | 11.1% | 12.2% |
| Interquartile Range (IQR) | 4.6% | 6.7% |
| Standard Deviation (Sample) | 3.8% | 5.0% |
| Standard Deviation (Population) | 3.8% | 4.9% |
Similar Demographics by Unemployment Among Seniors over 75 years
Demographics Similar to Indians (Asian) by Unemployment Among Seniors over 75 years
In terms of unemployment among seniors over 75 years, the demographic groups most similar to Indians (Asian) are Immigrants from South Africa (8.0%, a difference of 0.010%), Immigrants from Argentina (8.0%, a difference of 0.080%), Immigrants from Syria (8.0%, a difference of 0.10%), Immigrants from Austria (8.0%, a difference of 0.14%), and Immigrants from Cambodia (8.0%, a difference of 0.15%).
| Demographics | Rating | Rank | Unemployment Among Seniors over 75 years |
| Immigrants | Albania | 99.9 /100 | #62 | Exceptional 7.9% |
| Immigrants | Nicaragua | 99.9 /100 | #63 | Exceptional 7.9% |
| Immigrants | Taiwan | 99.9 /100 | #64 | Exceptional 7.9% |
| Argentineans | 99.9 /100 | #65 | Exceptional 7.9% |
| Immigrants | Austria | 99.9 /100 | #66 | Exceptional 8.0% |
| Immigrants | Syria | 99.9 /100 | #67 | Exceptional 8.0% |
| Immigrants | South Africa | 99.9 /100 | #68 | Exceptional 8.0% |
| Indians (Asian) | 99.9 /100 | #69 | Exceptional 8.0% |
| Immigrants | Argentina | 99.9 /100 | #70 | Exceptional 8.0% |
| Immigrants | Cambodia | 99.9 /100 | #71 | Exceptional 8.0% |
| Bolivians | 99.9 /100 | #72 | Exceptional 8.0% |
| Immigrants | France | 99.9 /100 | #73 | Exceptional 8.0% |
| Spanish Americans | 99.8 /100 | #74 | Exceptional 8.0% |
| Immigrants | Uganda | 99.8 /100 | #75 | Exceptional 8.0% |
| Immigrants | Venezuela | 99.8 /100 | #76 | Exceptional 8.0% |
Demographics Similar to Spanish American Indians by Unemployment Among Seniors over 75 years
In terms of unemployment among seniors over 75 years, the demographic groups most similar to Spanish American Indians are Immigrants from Armenia (6.5%, a difference of 0.39%), Taiwanese (6.6%, a difference of 0.41%), Soviet Union (6.6%, a difference of 1.7%), Yuman (6.7%, a difference of 1.9%), and Immigrants from Grenada (6.7%, a difference of 2.0%).
| Demographics | Rating | Rank | Unemployment Among Seniors over 75 years |
| Crow | 100.0 /100 | #1 | Exceptional 5.9% |
| Chinese | 100.0 /100 | #2 | Exceptional 5.9% |
| Cheyenne | 100.0 /100 | #3 | Exceptional 5.9% |
| Alsatians | 100.0 /100 | #4 | Exceptional 6.1% |
| Hopi | 100.0 /100 | #5 | Exceptional 6.3% |
| Immigrants | Armenia | 100.0 /100 | #6 | Exceptional 6.5% |
| Spanish American Indians | 100.0 /100 | #7 | Exceptional 6.5% |
| Taiwanese | 100.0 /100 | #8 | Exceptional 6.6% |
| Soviet Union | 100.0 /100 | #9 | Exceptional 6.6% |
| Yuman | 100.0 /100 | #10 | Exceptional 6.7% |
| Immigrants | Grenada | 100.0 /100 | #11 | Exceptional 6.7% |
| Comanche | 100.0 /100 | #12 | Exceptional 6.7% |
| Immigrants | Congo | 100.0 /100 | #13 | Exceptional 6.7% |
| Ute | 100.0 /100 | #14 | Exceptional 6.8% |
| Icelanders | 100.0 /100 | #15 | Exceptional 7.0% |