Indian (Asian) vs Immigrants from Latin America 9th Grade
COMPARE
Indian (Asian)
Immigrants from Latin America
9th Grade
9th Grade Comparison
Indians (Asian)
Immigrants from Latin America
94.5%
9TH GRADE
8.6/ 100
METRIC RATING
220th/ 347
METRIC RANK
90.4%
9TH GRADE
0.0/ 100
METRIC RATING
337th/ 347
METRIC RANK
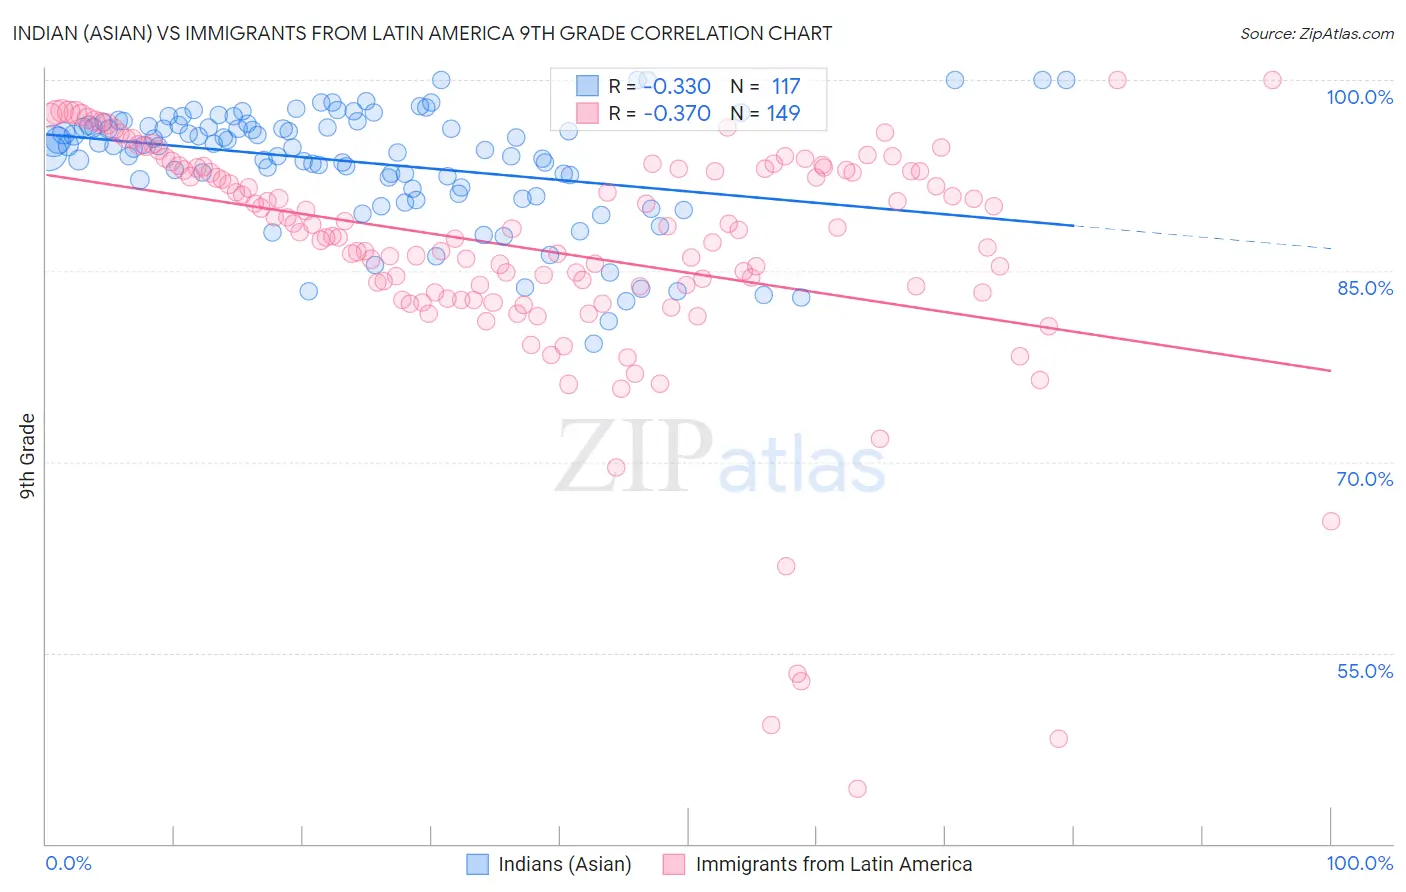
Indian (Asian) vs Immigrants from Latin America 9th Grade Correlation Chart
The statistical analysis conducted on geographies consisting of 495,348,182 people shows a mild negative correlation between the proportion of Indians (Asian) and percentage of population with at least 9th grade education in the United States with a correlation coefficient (R) of -0.330 and weighted average of 94.5%. Similarly, the statistical analysis conducted on geographies consisting of 558,651,576 people shows a mild negative correlation between the proportion of Immigrants from Latin America and percentage of population with at least 9th grade education in the United States with a correlation coefficient (R) of -0.370 and weighted average of 90.4%, a difference of 4.5%.
9th Grade Correlation Summary
| Measurement | Indian (Asian) | Immigrants from Latin America |
| Minimum | 79.3% | 44.3% |
| Maximum | 100.0% | 100.0% |
| Range | 20.7% | 55.7% |
| Mean | 93.5% | 86.7% |
| Median | 94.8% | 88.2% |
| Interquartile 25% (IQ1) | 91.5% | 83.3% |
| Interquartile 75% (IQ3) | 96.5% | 93.0% |
| Interquartile Range (IQR) | 5.0% | 9.7% |
| Standard Deviation (Sample) | 4.5% | 9.6% |
| Standard Deviation (Population) | 4.5% | 9.5% |
Similar Demographics by 9th Grade
Demographics Similar to Indians (Asian) by 9th Grade
In terms of 9th grade, the demographic groups most similar to Indians (Asian) are Portuguese (94.5%, a difference of 0.010%), African (94.5%, a difference of 0.010%), Immigrants from Eastern Africa (94.5%, a difference of 0.010%), Immigrants from Asia (94.4%, a difference of 0.020%), and Asian (94.5%, a difference of 0.030%).
| Demographics | Rating | Rank | 9th Grade |
| Immigrants | Oceania | 12.1 /100 | #213 | Poor 94.5% |
| Immigrants | Liberia | 11.8 /100 | #214 | Poor 94.5% |
| Immigrants | Syria | 11.0 /100 | #215 | Poor 94.5% |
| Immigrants | Western Asia | 10.7 /100 | #216 | Poor 94.5% |
| Asians | 9.9 /100 | #217 | Tragic 94.5% |
| Portuguese | 9.2 /100 | #218 | Tragic 94.5% |
| Africans | 9.0 /100 | #219 | Tragic 94.5% |
| Indians (Asian) | 8.6 /100 | #220 | Tragic 94.5% |
| Immigrants | Eastern Africa | 8.2 /100 | #221 | Tragic 94.5% |
| Immigrants | Asia | 7.7 /100 | #222 | Tragic 94.4% |
| Bahamians | 7.0 /100 | #223 | Tragic 94.4% |
| Tongans | 6.0 /100 | #224 | Tragic 94.4% |
| Ethiopians | 5.4 /100 | #225 | Tragic 94.4% |
| Sub-Saharan Africans | 5.4 /100 | #226 | Tragic 94.4% |
| Immigrants | Sierra Leone | 4.8 /100 | #227 | Tragic 94.4% |
Demographics Similar to Immigrants from Latin America by 9th Grade
In terms of 9th grade, the demographic groups most similar to Immigrants from Latin America are Central American (90.4%, a difference of 0.010%), Immigrants from Dominican Republic (90.5%, a difference of 0.12%), Immigrants from Honduras (90.6%, a difference of 0.25%), Yakama (90.1%, a difference of 0.35%), and Mexican (90.0%, a difference of 0.41%).
| Demographics | Rating | Rank | 9th Grade |
| Immigrants | Cabo Verde | 0.0 /100 | #330 | Tragic 90.9% |
| Mexican American Indians | 0.0 /100 | #331 | Tragic 90.9% |
| Hispanics or Latinos | 0.0 /100 | #332 | Tragic 90.9% |
| Immigrants | Yemen | 0.0 /100 | #333 | Tragic 90.8% |
| Immigrants | Azores | 0.0 /100 | #334 | Tragic 90.8% |
| Immigrants | Honduras | 0.0 /100 | #335 | Tragic 90.6% |
| Immigrants | Dominican Republic | 0.0 /100 | #336 | Tragic 90.5% |
| Immigrants | Latin America | 0.0 /100 | #337 | Tragic 90.4% |
| Central Americans | 0.0 /100 | #338 | Tragic 90.4% |
| Yakama | 0.0 /100 | #339 | Tragic 90.1% |
| Mexicans | 0.0 /100 | #340 | Tragic 90.0% |
| Guatemalans | 0.0 /100 | #341 | Tragic 89.9% |
| Salvadorans | 0.0 /100 | #342 | Tragic 89.6% |
| Immigrants | Guatemala | 0.0 /100 | #343 | Tragic 89.4% |
| Immigrants | El Salvador | 0.0 /100 | #344 | Tragic 89.0% |