Indian (Asian) vs Spanish American Indian Associate's Degree
COMPARE
Indian (Asian)
Spanish American Indian
Associate's Degree
Associate's Degree Comparison
Indians (Asian)
Spanish American Indians
54.8%
ASSOCIATE'S DEGREE
100.0/ 100
METRIC RATING
18th/ 347
METRIC RANK
34.9%
ASSOCIATE'S DEGREE
0.0/ 100
METRIC RATING
335th/ 347
METRIC RANK
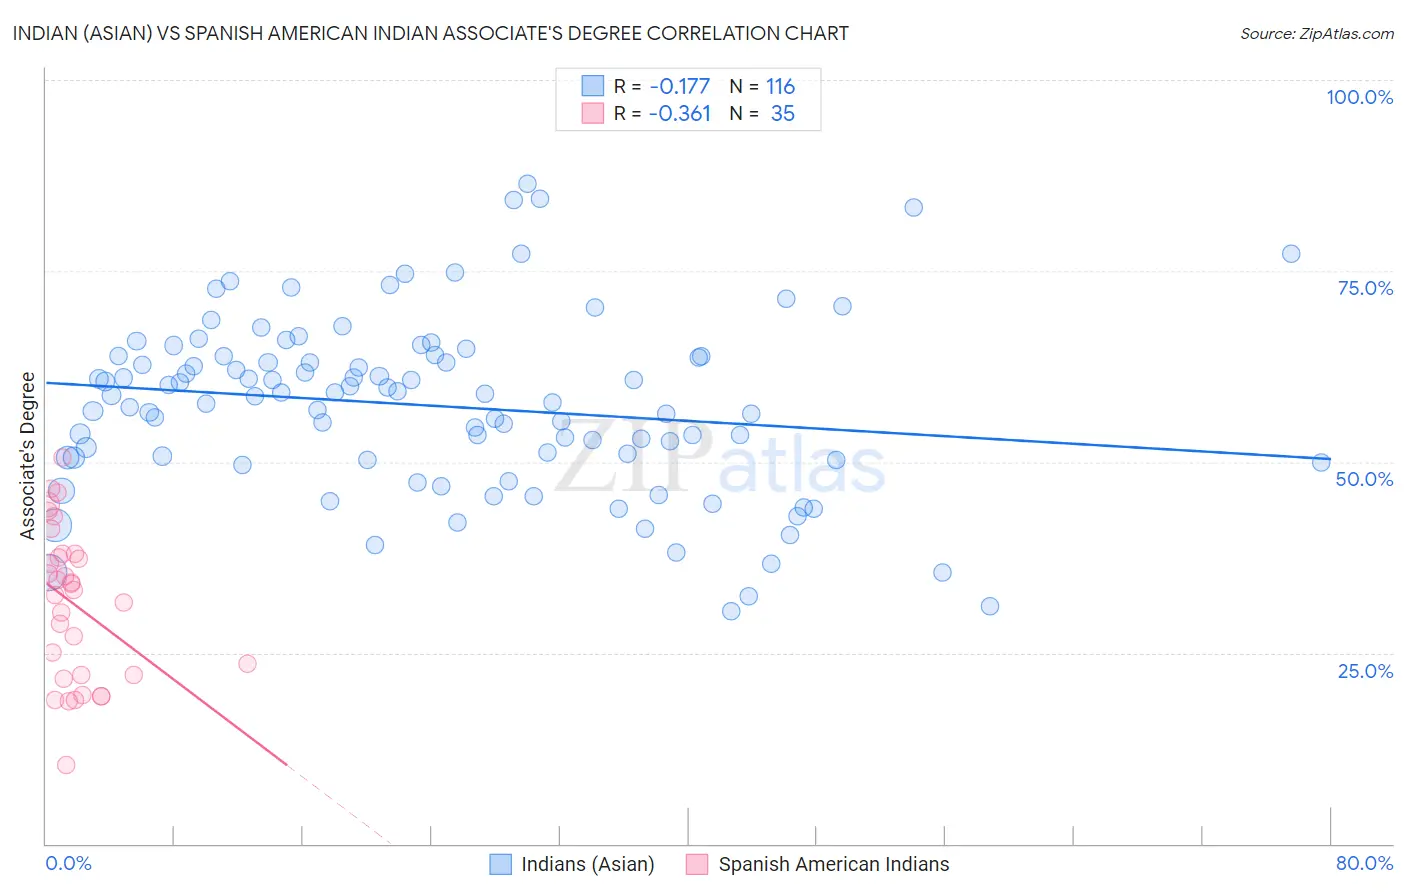
Indian (Asian) vs Spanish American Indian Associate's Degree Correlation Chart
The statistical analysis conducted on geographies consisting of 495,274,508 people shows a poor negative correlation between the proportion of Indians (Asian) and percentage of population with at least associate's degree education in the United States with a correlation coefficient (R) of -0.177 and weighted average of 54.8%. Similarly, the statistical analysis conducted on geographies consisting of 73,150,359 people shows a mild negative correlation between the proportion of Spanish American Indians and percentage of population with at least associate's degree education in the United States with a correlation coefficient (R) of -0.361 and weighted average of 34.9%, a difference of 57.1%.
Associate's Degree Correlation Summary
| Measurement | Indian (Asian) | Spanish American Indian |
| Minimum | 30.4% | 10.3% |
| Maximum | 86.5% | 50.6% |
| Range | 56.1% | 40.3% |
| Mean | 57.3% | 31.4% |
| Median | 58.6% | 33.2% |
| Interquartile 25% (IQ1) | 50.4% | 22.0% |
| Interquartile 75% (IQ3) | 63.9% | 37.9% |
| Interquartile Range (IQR) | 13.4% | 15.8% |
| Standard Deviation (Sample) | 11.5% | 9.9% |
| Standard Deviation (Population) | 11.4% | 9.8% |
Similar Demographics by Associate's Degree
Demographics Similar to Indians (Asian) by Associate's Degree
In terms of associate's degree, the demographic groups most similar to Indians (Asian) are Immigrants from Ireland (54.7%, a difference of 0.22%), Cambodian (54.6%, a difference of 0.24%), Immigrants from Sweden (54.6%, a difference of 0.31%), Immigrants from Japan (54.6%, a difference of 0.34%), and Burmese (54.6%, a difference of 0.34%).
| Demographics | Rating | Rank | Associate's Degree |
| Immigrants | Australia | 100.0 /100 | #11 | Exceptional 55.8% |
| Immigrants | South Central Asia | 100.0 /100 | #12 | Exceptional 55.7% |
| Immigrants | China | 100.0 /100 | #13 | Exceptional 55.5% |
| Immigrants | Hong Kong | 100.0 /100 | #14 | Exceptional 55.4% |
| Immigrants | Eastern Asia | 100.0 /100 | #15 | Exceptional 55.4% |
| Soviet Union | 100.0 /100 | #16 | Exceptional 55.1% |
| Eastern Europeans | 100.0 /100 | #17 | Exceptional 55.0% |
| Indians (Asian) | 100.0 /100 | #18 | Exceptional 54.8% |
| Immigrants | Ireland | 100.0 /100 | #19 | Exceptional 54.7% |
| Cambodians | 100.0 /100 | #20 | Exceptional 54.6% |
| Immigrants | Sweden | 100.0 /100 | #21 | Exceptional 54.6% |
| Immigrants | Japan | 100.0 /100 | #22 | Exceptional 54.6% |
| Burmese | 100.0 /100 | #23 | Exceptional 54.6% |
| Immigrants | Korea | 100.0 /100 | #24 | Exceptional 54.5% |
| Immigrants | Switzerland | 100.0 /100 | #25 | Exceptional 54.5% |
Demographics Similar to Spanish American Indians by Associate's Degree
In terms of associate's degree, the demographic groups most similar to Spanish American Indians are Native/Alaskan (34.9%, a difference of 0.14%), Mexican (35.0%, a difference of 0.37%), Immigrants from Central America (35.0%, a difference of 0.45%), Hopi (34.6%, a difference of 0.88%), and Lumbee (34.1%, a difference of 2.2%).
| Demographics | Rating | Rank | Associate's Degree |
| Alaskan Athabascans | 0.0 /100 | #328 | Tragic 36.5% |
| Paiute | 0.0 /100 | #329 | Tragic 36.4% |
| Apache | 0.0 /100 | #330 | Tragic 36.2% |
| Immigrants | Azores | 0.0 /100 | #331 | Tragic 35.6% |
| Immigrants | Central America | 0.0 /100 | #332 | Tragic 35.0% |
| Mexicans | 0.0 /100 | #333 | Tragic 35.0% |
| Natives/Alaskans | 0.0 /100 | #334 | Tragic 34.9% |
| Spanish American Indians | 0.0 /100 | #335 | Tragic 34.9% |
| Hopi | 0.0 /100 | #336 | Tragic 34.6% |
| Lumbee | 0.0 /100 | #337 | Tragic 34.1% |
| Pueblo | 0.0 /100 | #338 | Tragic 34.0% |
| Immigrants | Mexico | 0.0 /100 | #339 | Tragic 33.7% |
| Navajo | 0.0 /100 | #340 | Tragic 32.6% |
| Inupiat | 0.0 /100 | #341 | Tragic 32.6% |
| Yakama | 0.0 /100 | #342 | Tragic 32.3% |