Indian (Asian) vs Canadian No Schooling Completed
COMPARE
Indian (Asian)
Canadian
No Schooling Completed
No Schooling Completed Comparison
Indians (Asian)
Canadians
2.5%
NO SCHOOLING COMPLETED
0.4/ 100
METRIC RATING
264th/ 347
METRIC RANK
1.7%
NO SCHOOLING COMPLETED
99.7/ 100
METRIC RATING
66th/ 347
METRIC RANK
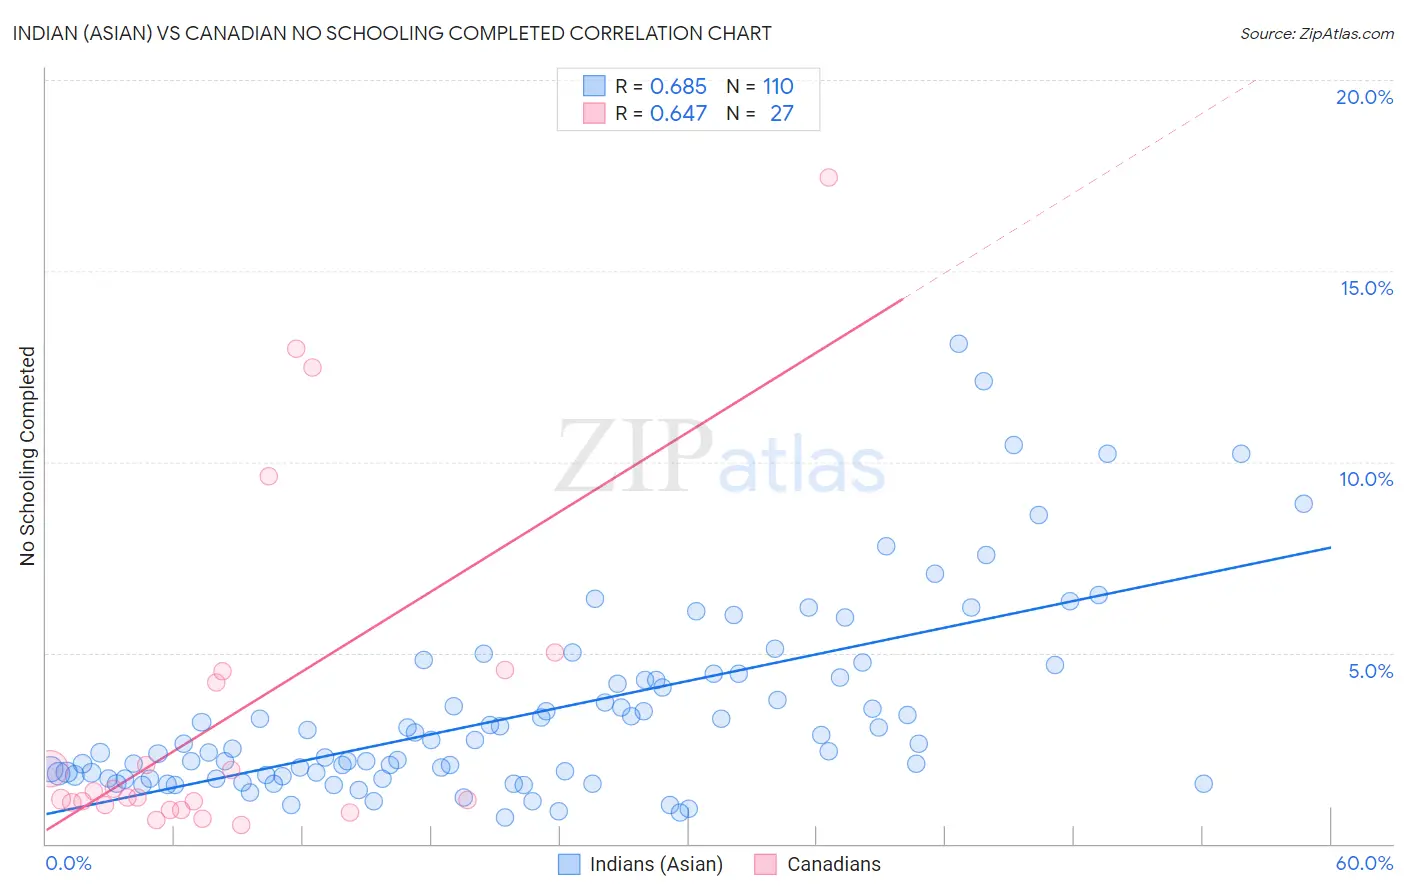
Indian (Asian) vs Canadian No Schooling Completed Correlation Chart
The statistical analysis conducted on geographies consisting of 487,020,053 people shows a significant positive correlation between the proportion of Indians (Asian) and percentage of population with no schooling in the United States with a correlation coefficient (R) of 0.685 and weighted average of 2.5%. Similarly, the statistical analysis conducted on geographies consisting of 430,389,571 people shows a significant positive correlation between the proportion of Canadians and percentage of population with no schooling in the United States with a correlation coefficient (R) of 0.647 and weighted average of 1.7%, a difference of 47.8%.
No Schooling Completed Correlation Summary
| Measurement | Indian (Asian) | Canadian |
| Minimum | 0.70% | 0.49% |
| Maximum | 13.1% | 17.5% |
| Range | 12.4% | 17.0% |
| Mean | 3.4% | 3.4% |
| Median | 2.6% | 1.2% |
| Interquartile 25% (IQ1) | 1.8% | 1.0% |
| Interquartile 75% (IQ3) | 4.3% | 4.5% |
| Interquartile Range (IQR) | 2.5% | 3.5% |
| Standard Deviation (Sample) | 2.5% | 4.4% |
| Standard Deviation (Population) | 2.5% | 4.4% |
Similar Demographics by No Schooling Completed
Demographics Similar to Indians (Asian) by No Schooling Completed
In terms of no schooling completed, the demographic groups most similar to Indians (Asian) are Immigrants from Liberia (2.5%, a difference of 0.13%), West Indian (2.5%, a difference of 0.18%), Fijian (2.5%, a difference of 0.26%), Immigrants from Sierra Leone (2.5%, a difference of 0.30%), and Yuman (2.5%, a difference of 0.43%).
| Demographics | Rating | Rank | No Schooling Completed |
| Immigrants | South America | 0.6 /100 | #257 | Tragic 2.5% |
| Assyrians/Chaldeans/Syriacs | 0.6 /100 | #258 | Tragic 2.5% |
| Immigrants | Jamaica | 0.6 /100 | #259 | Tragic 2.5% |
| Immigrants | Ethiopia | 0.6 /100 | #260 | Tragic 2.5% |
| Armenians | 0.5 /100 | #261 | Tragic 2.5% |
| Immigrants | Sierra Leone | 0.5 /100 | #262 | Tragic 2.5% |
| Immigrants | Liberia | 0.4 /100 | #263 | Tragic 2.5% |
| Indians (Asian) | 0.4 /100 | #264 | Tragic 2.5% |
| West Indians | 0.4 /100 | #265 | Tragic 2.5% |
| Fijians | 0.4 /100 | #266 | Tragic 2.5% |
| Yuman | 0.4 /100 | #267 | Tragic 2.5% |
| Taiwanese | 0.3 /100 | #268 | Tragic 2.5% |
| Immigrants | Nigeria | 0.2 /100 | #269 | Tragic 2.5% |
| Immigrants | Peru | 0.2 /100 | #270 | Tragic 2.5% |
| Cubans | 0.2 /100 | #271 | Tragic 2.5% |
Demographics Similar to Canadians by No Schooling Completed
In terms of no schooling completed, the demographic groups most similar to Canadians are Serbian (1.7%, a difference of 0.14%), New Zealander (1.7%, a difference of 0.18%), Immigrants from Austria (1.7%, a difference of 0.19%), Russian (1.7%, a difference of 0.34%), and Immigrants from Northern Europe (1.7%, a difference of 0.38%).
| Demographics | Rating | Rank | No Schooling Completed |
| Slavs | 99.8 /100 | #59 | Exceptional 1.7% |
| Americans | 99.8 /100 | #60 | Exceptional 1.7% |
| Tsimshian | 99.8 /100 | #61 | Exceptional 1.7% |
| Immigrants | Northern Europe | 99.8 /100 | #62 | Exceptional 1.7% |
| Russians | 99.8 /100 | #63 | Exceptional 1.7% |
| New Zealanders | 99.7 /100 | #64 | Exceptional 1.7% |
| Serbians | 99.7 /100 | #65 | Exceptional 1.7% |
| Canadians | 99.7 /100 | #66 | Exceptional 1.7% |
| Immigrants | Austria | 99.7 /100 | #67 | Exceptional 1.7% |
| Immigrants | Lithuania | 99.7 /100 | #68 | Exceptional 1.7% |
| Chickasaw | 99.6 /100 | #69 | Exceptional 1.7% |
| Immigrants | Netherlands | 99.6 /100 | #70 | Exceptional 1.7% |
| Immigrants | England | 99.5 /100 | #71 | Exceptional 1.7% |
| Cajuns | 99.5 /100 | #72 | Exceptional 1.7% |
| Immigrants | India | 99.4 /100 | #73 | Exceptional 1.7% |