Indian (Asian) vs Immigrants from Ecuador Female Poverty Among 18-24 Year Olds
COMPARE
Indian (Asian)
Immigrants from Ecuador
Female Poverty Among 18-24 Year Olds
Female Poverty Among 18-24 Year Olds Comparison
Indians (Asian)
Immigrants from Ecuador
19.6%
FEMALE POVERTY AMONG 18-24 YEAR OLDS
88.3/ 100
METRIC RATING
139th/ 347
METRIC RANK
19.2%
FEMALE POVERTY AMONG 18-24 YEAR OLDS
97.8/ 100
METRIC RATING
105th/ 347
METRIC RANK
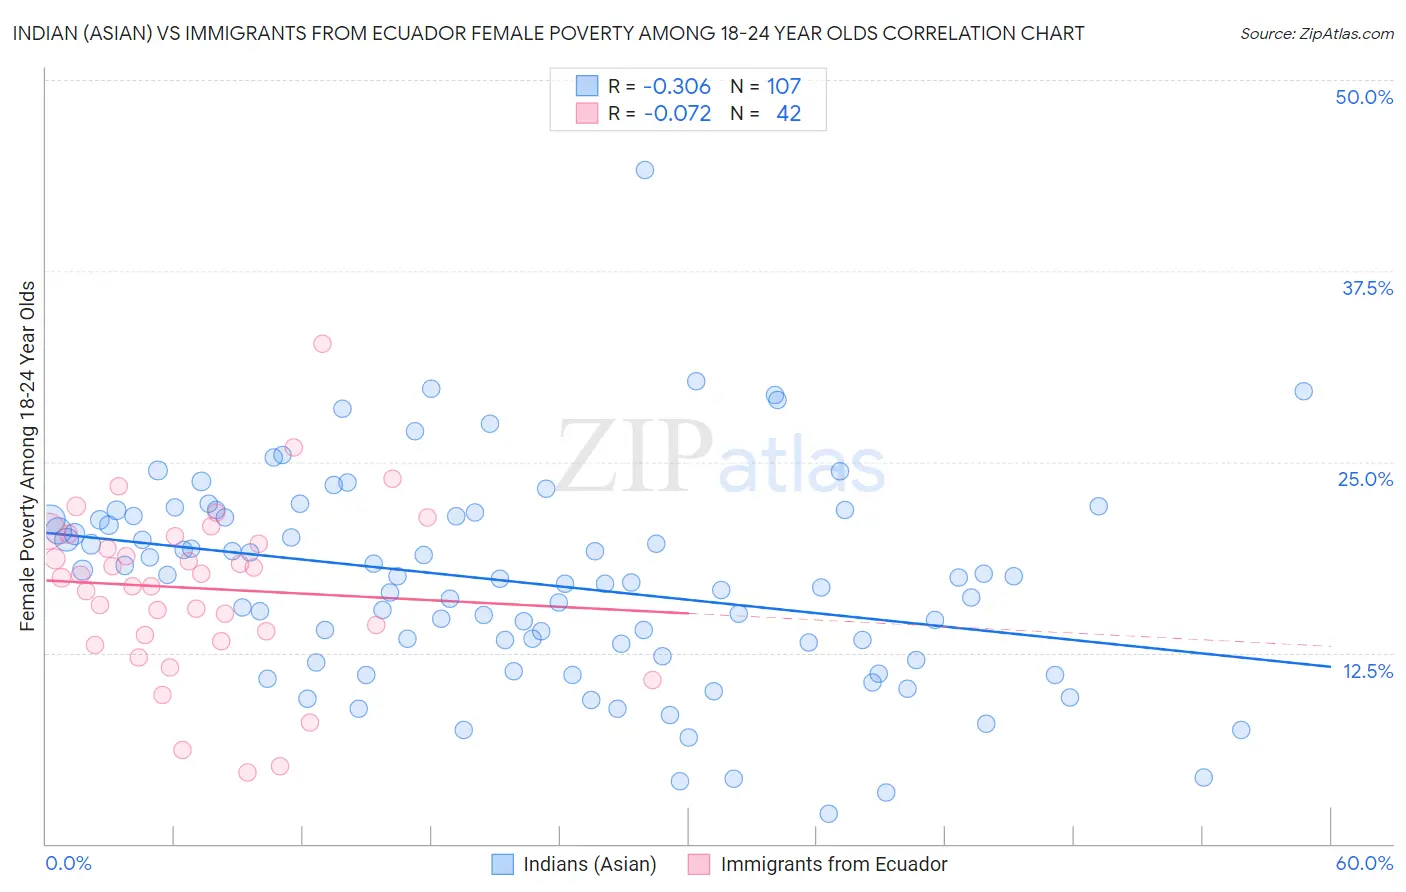
Indian (Asian) vs Immigrants from Ecuador Female Poverty Among 18-24 Year Olds Correlation Chart
The statistical analysis conducted on geographies consisting of 476,846,332 people shows a mild negative correlation between the proportion of Indians (Asian) and poverty level among females between the ages 18 and 24 in the United States with a correlation coefficient (R) of -0.306 and weighted average of 19.6%. Similarly, the statistical analysis conducted on geographies consisting of 266,188,241 people shows a slight negative correlation between the proportion of Immigrants from Ecuador and poverty level among females between the ages 18 and 24 in the United States with a correlation coefficient (R) of -0.072 and weighted average of 19.2%, a difference of 2.3%.
Female Poverty Among 18-24 Year Olds Correlation Summary
| Measurement | Indian (Asian) | Immigrants from Ecuador |
| Minimum | 2.0% | 4.7% |
| Maximum | 44.1% | 32.8% |
| Range | 42.1% | 28.1% |
| Mean | 17.1% | 16.7% |
| Median | 17.4% | 17.5% |
| Interquartile 25% (IQ1) | 12.3% | 13.7% |
| Interquartile 75% (IQ3) | 21.4% | 20.2% |
| Interquartile Range (IQR) | 9.1% | 6.5% |
| Standard Deviation (Sample) | 6.8% | 5.5% |
| Standard Deviation (Population) | 6.8% | 5.5% |
Similar Demographics by Female Poverty Among 18-24 Year Olds
Demographics Similar to Indians (Asian) by Female Poverty Among 18-24 Year Olds
In terms of female poverty among 18-24 year olds, the demographic groups most similar to Indians (Asian) are Immigrants from Morocco (19.6%, a difference of 0.20%), Immigrants from Trinidad and Tobago (19.7%, a difference of 0.30%), Pennsylvania German (19.7%, a difference of 0.31%), Austrian (19.5%, a difference of 0.32%), and Panamanian (19.7%, a difference of 0.41%).
| Demographics | Rating | Rank | Female Poverty Among 18-24 Year Olds |
| Jamaicans | 92.1 /100 | #132 | Exceptional 19.5% |
| Turks | 92.1 /100 | #133 | Exceptional 19.5% |
| Immigrants | North America | 92.1 /100 | #134 | Exceptional 19.5% |
| Soviet Union | 92.0 /100 | #135 | Exceptional 19.5% |
| Russians | 91.5 /100 | #136 | Exceptional 19.5% |
| Austrians | 90.7 /100 | #137 | Exceptional 19.5% |
| Immigrants | Morocco | 89.9 /100 | #138 | Excellent 19.6% |
| Indians (Asian) | 88.3 /100 | #139 | Excellent 19.6% |
| Immigrants | Trinidad and Tobago | 85.6 /100 | #140 | Excellent 19.7% |
| Pennsylvania Germans | 85.5 /100 | #141 | Excellent 19.7% |
| Panamanians | 84.6 /100 | #142 | Excellent 19.7% |
| Slavs | 84.4 /100 | #143 | Excellent 19.7% |
| Immigrants | Northern Africa | 84.1 /100 | #144 | Excellent 19.7% |
| Canadians | 83.8 /100 | #145 | Excellent 19.7% |
| Immigrants | Bosnia and Herzegovina | 83.6 /100 | #146 | Excellent 19.7% |
Demographics Similar to Immigrants from Ecuador by Female Poverty Among 18-24 Year Olds
In terms of female poverty among 18-24 year olds, the demographic groups most similar to Immigrants from Ecuador are Immigrants from Sierra Leone (19.2%, a difference of 0.040%), Immigrants from Afghanistan (19.1%, a difference of 0.090%), Serbian (19.1%, a difference of 0.13%), Immigrants from Caribbean (19.1%, a difference of 0.17%), and Ecuadorian (19.1%, a difference of 0.19%).
| Demographics | Rating | Rank | Female Poverty Among 18-24 Year Olds |
| Immigrants | Jordan | 98.4 /100 | #98 | Exceptional 19.1% |
| Immigrants | Czechoslovakia | 98.3 /100 | #99 | Exceptional 19.1% |
| Chileans | 98.3 /100 | #100 | Exceptional 19.1% |
| Ecuadorians | 98.1 /100 | #101 | Exceptional 19.1% |
| Immigrants | Caribbean | 98.1 /100 | #102 | Exceptional 19.1% |
| Serbians | 98.0 /100 | #103 | Exceptional 19.1% |
| Immigrants | Afghanistan | 98.0 /100 | #104 | Exceptional 19.1% |
| Immigrants | Ecuador | 97.8 /100 | #105 | Exceptional 19.2% |
| Immigrants | Sierra Leone | 97.8 /100 | #106 | Exceptional 19.2% |
| Immigrants | Sri Lanka | 97.5 /100 | #107 | Exceptional 19.2% |
| Immigrants | Uzbekistan | 97.3 /100 | #108 | Exceptional 19.2% |
| Immigrants | Syria | 97.2 /100 | #109 | Exceptional 19.2% |
| Laotians | 97.1 /100 | #110 | Exceptional 19.2% |
| Immigrants | Serbia | 97.1 /100 | #111 | Exceptional 19.2% |
| Immigrants | El Salvador | 96.5 /100 | #112 | Exceptional 19.3% |