Immigrants vs West Indian Female Poverty Among 18-24 Year Olds
COMPARE
Immigrants
West Indian
Female Poverty Among 18-24 Year Olds
Female Poverty Among 18-24 Year Olds Comparison
Immigrants
West Indians
19.3%
FEMALE POVERTY AMONG 18-24 YEAR OLDS
95.9/ 100
METRIC RATING
116th/ 347
METRIC RANK
21.1%
FEMALE POVERTY AMONG 18-24 YEAR OLDS
1.9/ 100
METRIC RATING
251st/ 347
METRIC RANK
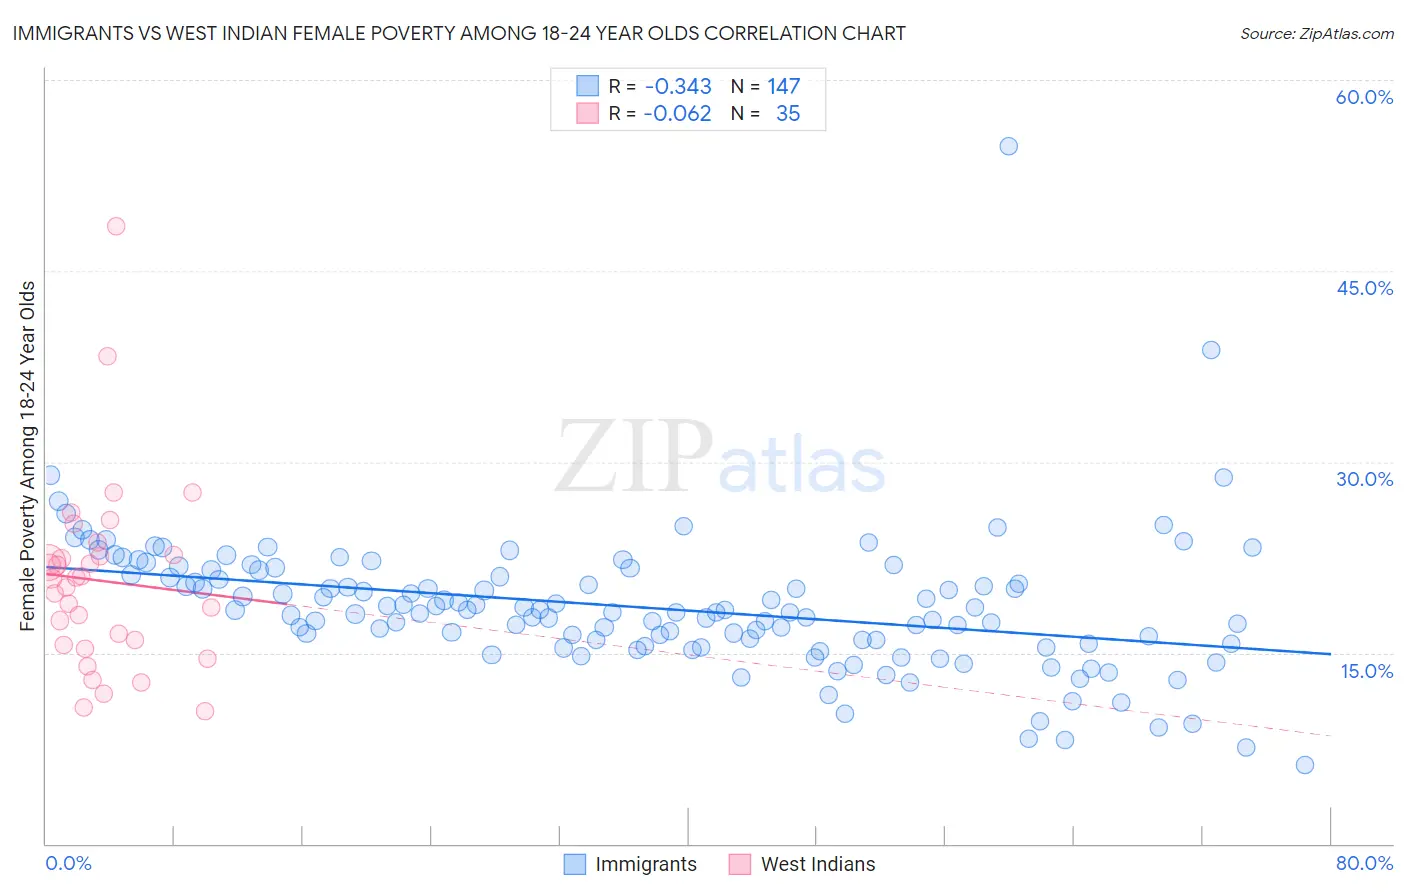
Immigrants vs West Indian Female Poverty Among 18-24 Year Olds Correlation Chart
The statistical analysis conducted on geographies consisting of 542,481,835 people shows a mild negative correlation between the proportion of Immigrants and poverty level among females between the ages 18 and 24 in the United States with a correlation coefficient (R) of -0.343 and weighted average of 19.3%. Similarly, the statistical analysis conducted on geographies consisting of 250,472,705 people shows a slight negative correlation between the proportion of West Indians and poverty level among females between the ages 18 and 24 in the United States with a correlation coefficient (R) of -0.062 and weighted average of 21.1%, a difference of 9.0%.
Female Poverty Among 18-24 Year Olds Correlation Summary
| Measurement | Immigrants | West Indian |
| Minimum | 6.2% | 10.4% |
| Maximum | 54.8% | 48.5% |
| Range | 48.6% | 38.1% |
| Mean | 18.6% | 20.7% |
| Median | 18.2% | 20.8% |
| Interquartile 25% (IQ1) | 15.7% | 15.6% |
| Interquartile 75% (IQ3) | 21.1% | 22.6% |
| Interquartile Range (IQR) | 5.4% | 7.0% |
| Standard Deviation (Sample) | 5.4% | 7.5% |
| Standard Deviation (Population) | 5.4% | 7.4% |
Similar Demographics by Female Poverty Among 18-24 Year Olds
Demographics Similar to Immigrants by Female Poverty Among 18-24 Year Olds
In terms of female poverty among 18-24 year olds, the demographic groups most similar to Immigrants are Immigrants from Iran (19.3%, a difference of 0.030%), Immigrants from Guyana (19.3%, a difference of 0.090%), Immigrants from Hungary (19.3%, a difference of 0.10%), Slovene (19.3%, a difference of 0.11%), and Cypriot (19.3%, a difference of 0.11%).
| Demographics | Rating | Rank | Female Poverty Among 18-24 Year Olds |
| Immigrants | Syria | 97.2 /100 | #109 | Exceptional 19.2% |
| Laotians | 97.1 /100 | #110 | Exceptional 19.2% |
| Immigrants | Serbia | 97.1 /100 | #111 | Exceptional 19.2% |
| Immigrants | El Salvador | 96.5 /100 | #112 | Exceptional 19.3% |
| Immigrants | Cameroon | 96.3 /100 | #113 | Exceptional 19.3% |
| Slovenes | 96.2 /100 | #114 | Exceptional 19.3% |
| Immigrants | Hungary | 96.2 /100 | #115 | Exceptional 19.3% |
| Immigrants | Immigrants | 95.9 /100 | #116 | Exceptional 19.3% |
| Immigrants | Iran | 95.8 /100 | #117 | Exceptional 19.3% |
| Immigrants | Guyana | 95.6 /100 | #118 | Exceptional 19.3% |
| Cypriots | 95.5 /100 | #119 | Exceptional 19.3% |
| Immigrants | Northern Europe | 95.4 /100 | #120 | Exceptional 19.4% |
| Guyanese | 95.3 /100 | #121 | Exceptional 19.4% |
| Cambodians | 94.6 /100 | #122 | Exceptional 19.4% |
| Paraguayans | 94.6 /100 | #123 | Exceptional 19.4% |
Demographics Similar to West Indians by Female Poverty Among 18-24 Year Olds
In terms of female poverty among 18-24 year olds, the demographic groups most similar to West Indians are South African (21.1%, a difference of 0.18%), Immigrants from West Indies (21.0%, a difference of 0.20%), Delaware (21.1%, a difference of 0.23%), Carpatho Rusyn (21.0%, a difference of 0.33%), and Immigrants from Kenya (21.0%, a difference of 0.35%).
| Demographics | Rating | Rank | Female Poverty Among 18-24 Year Olds |
| Immigrants | Thailand | 3.4 /100 | #244 | Tragic 20.9% |
| Aleuts | 3.3 /100 | #245 | Tragic 20.9% |
| Immigrants | Australia | 3.1 /100 | #246 | Tragic 20.9% |
| Immigrants | Africa | 3.0 /100 | #247 | Tragic 21.0% |
| Immigrants | Kenya | 2.5 /100 | #248 | Tragic 21.0% |
| Carpatho Rusyns | 2.5 /100 | #249 | Tragic 21.0% |
| Immigrants | West Indies | 2.2 /100 | #250 | Tragic 21.0% |
| West Indians | 1.9 /100 | #251 | Tragic 21.1% |
| South Africans | 1.6 /100 | #252 | Tragic 21.1% |
| Delaware | 1.6 /100 | #253 | Tragic 21.1% |
| British West Indians | 1.2 /100 | #254 | Tragic 21.2% |
| Immigrants | Grenada | 1.2 /100 | #255 | Tragic 21.2% |
| Tsimshian | 1.0 /100 | #256 | Tragic 21.2% |
| Taiwanese | 1.0 /100 | #257 | Tragic 21.2% |
| Vietnamese | 0.6 /100 | #258 | Tragic 21.4% |