Immigrants vs West Indian 2nd Grade
COMPARE
Immigrants
West Indian
2nd Grade
2nd Grade Comparison
Immigrants
West Indians
97.1%
2ND GRADE
0.0/ 100
METRIC RATING
296th/ 347
METRIC RANK
97.4%
2ND GRADE
0.3/ 100
METRIC RATING
269th/ 347
METRIC RANK
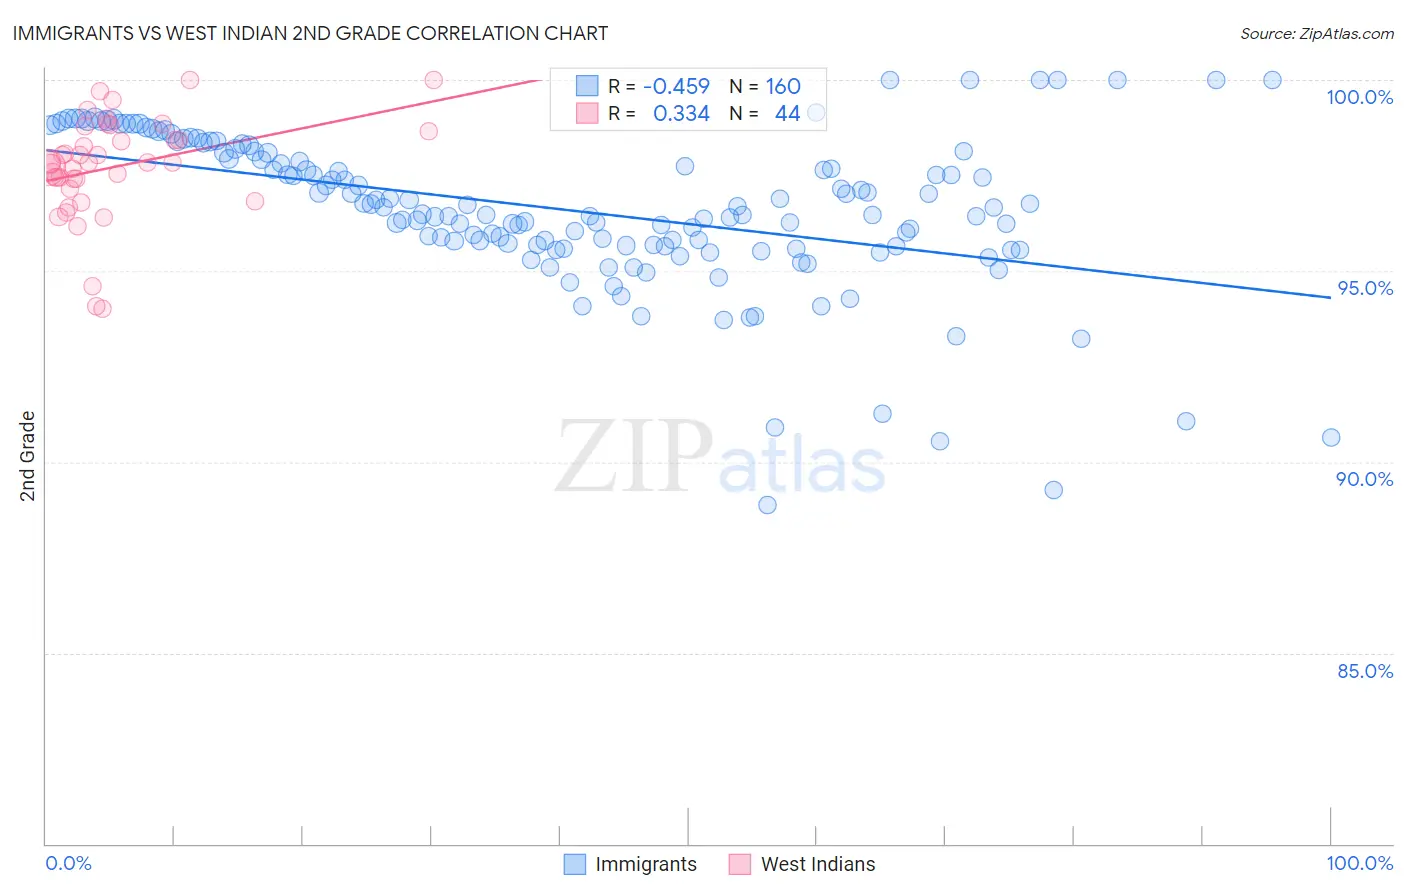
Immigrants vs West Indian 2nd Grade Correlation Chart
The statistical analysis conducted on geographies consisting of 577,788,049 people shows a moderate negative correlation between the proportion of Immigrants and percentage of population with at least 2nd grade education in the United States with a correlation coefficient (R) of -0.459 and weighted average of 97.1%. Similarly, the statistical analysis conducted on geographies consisting of 254,063,654 people shows a mild positive correlation between the proportion of West Indians and percentage of population with at least 2nd grade education in the United States with a correlation coefficient (R) of 0.334 and weighted average of 97.4%, a difference of 0.34%.
2nd Grade Correlation Summary
| Measurement | Immigrants | West Indian |
| Minimum | 88.9% | 94.0% |
| Maximum | 100.0% | 100.0% |
| Range | 11.1% | 6.0% |
| Mean | 96.6% | 97.7% |
| Median | 96.6% | 97.8% |
| Interquartile 25% (IQ1) | 95.7% | 97.3% |
| Interquartile 75% (IQ3) | 98.1% | 98.5% |
| Interquartile Range (IQR) | 2.5% | 1.3% |
| Standard Deviation (Sample) | 2.0% | 1.3% |
| Standard Deviation (Population) | 2.0% | 1.3% |
Similar Demographics by 2nd Grade
Demographics Similar to Immigrants by 2nd Grade
In terms of 2nd grade, the demographic groups most similar to Immigrants are Immigrants from Grenada (97.1%, a difference of 0.040%), Malaysian (97.1%, a difference of 0.060%), Immigrants from Cuba (97.0%, a difference of 0.060%), Immigrants from Dominica (97.0%, a difference of 0.070%), and Haitian (97.0%, a difference of 0.070%).
| Demographics | Rating | Rank | 2nd Grade |
| Houma | 0.0 /100 | #289 | Tragic 97.2% |
| Immigrants | St. Vincent and the Grenadines | 0.0 /100 | #290 | Tragic 97.2% |
| Immigrants | Afghanistan | 0.0 /100 | #291 | Tragic 97.2% |
| Immigrants | Eritrea | 0.0 /100 | #292 | Tragic 97.2% |
| British West Indians | 0.0 /100 | #293 | Tragic 97.2% |
| Malaysians | 0.0 /100 | #294 | Tragic 97.1% |
| Immigrants | Grenada | 0.0 /100 | #295 | Tragic 97.1% |
| Immigrants | Immigrants | 0.0 /100 | #296 | Tragic 97.1% |
| Immigrants | Cuba | 0.0 /100 | #297 | Tragic 97.0% |
| Immigrants | Dominica | 0.0 /100 | #298 | Tragic 97.0% |
| Haitians | 0.0 /100 | #299 | Tragic 97.0% |
| Immigrants | South Eastern Asia | 0.0 /100 | #300 | Tragic 97.0% |
| Central American Indians | 0.0 /100 | #301 | Tragic 97.0% |
| Somalis | 0.0 /100 | #302 | Tragic 97.0% |
| Ecuadorians | 0.0 /100 | #303 | Tragic 96.9% |
Demographics Similar to West Indians by 2nd Grade
In terms of 2nd grade, the demographic groups most similar to West Indians are Immigrants from Nigeria (97.4%, a difference of 0.0%), Cuban (97.4%, a difference of 0.010%), Immigrants from Sierra Leone (97.4%, a difference of 0.020%), Immigrants from Jamaica (97.4%, a difference of 0.020%), and Taiwanese (97.4%, a difference of 0.030%).
| Demographics | Rating | Rank | 2nd Grade |
| Taiwanese | 0.4 /100 | #262 | Tragic 97.4% |
| Immigrants | Ethiopia | 0.4 /100 | #263 | Tragic 97.4% |
| Immigrants | Liberia | 0.4 /100 | #264 | Tragic 97.4% |
| Immigrants | South America | 0.4 /100 | #265 | Tragic 97.4% |
| Immigrants | Sierra Leone | 0.4 /100 | #266 | Tragic 97.4% |
| Cubans | 0.3 /100 | #267 | Tragic 97.4% |
| Immigrants | Nigeria | 0.3 /100 | #268 | Tragic 97.4% |
| West Indians | 0.3 /100 | #269 | Tragic 97.4% |
| Immigrants | Jamaica | 0.2 /100 | #270 | Tragic 97.4% |
| Immigrants | Cameroon | 0.2 /100 | #271 | Tragic 97.4% |
| Immigrants | Peru | 0.1 /100 | #272 | Tragic 97.4% |
| Immigrants | Bolivia | 0.1 /100 | #273 | Tragic 97.4% |
| Ghanaians | 0.1 /100 | #274 | Tragic 97.4% |
| Immigrants | China | 0.1 /100 | #275 | Tragic 97.3% |
| Immigrants | Philippines | 0.1 /100 | #276 | Tragic 97.3% |