Immigrants vs Immigrants from India 2nd Grade
COMPARE
Immigrants
Immigrants from India
2nd Grade
2nd Grade Comparison
Immigrants
Immigrants from India
97.1%
2ND GRADE
0.0/ 100
METRIC RATING
296th/ 347
METRIC RANK
98.2%
2ND GRADE
98.8/ 100
METRIC RATING
93rd/ 347
METRIC RANK
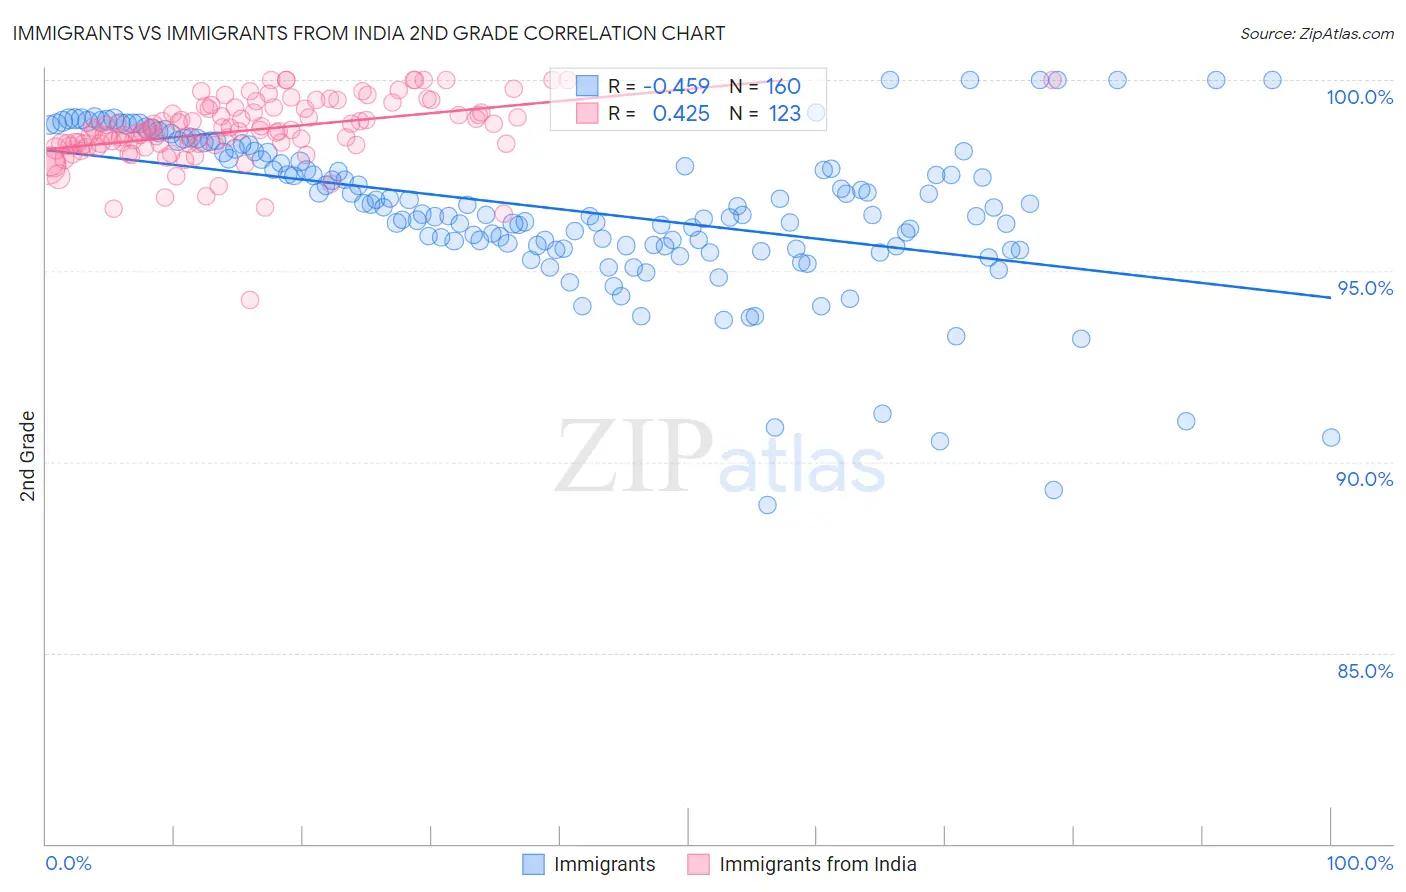
Immigrants vs Immigrants from India 2nd Grade Correlation Chart
The statistical analysis conducted on geographies consisting of 577,788,049 people shows a moderate negative correlation between the proportion of Immigrants and percentage of population with at least 2nd grade education in the United States with a correlation coefficient (R) of -0.459 and weighted average of 97.1%. Similarly, the statistical analysis conducted on geographies consisting of 434,105,844 people shows a moderate positive correlation between the proportion of Immigrants from India and percentage of population with at least 2nd grade education in the United States with a correlation coefficient (R) of 0.425 and weighted average of 98.2%, a difference of 1.2%.
2nd Grade Correlation Summary
| Measurement | Immigrants | Immigrants from India |
| Minimum | 88.9% | 94.2% |
| Maximum | 100.0% | 100.0% |
| Range | 11.1% | 5.8% |
| Mean | 96.6% | 98.7% |
| Median | 96.6% | 98.7% |
| Interquartile 25% (IQ1) | 95.7% | 98.3% |
| Interquartile 75% (IQ3) | 98.1% | 99.2% |
| Interquartile Range (IQR) | 2.5% | 0.96% |
| Standard Deviation (Sample) | 2.0% | 0.86% |
| Standard Deviation (Population) | 2.0% | 0.86% |
Similar Demographics by 2nd Grade
Demographics Similar to Immigrants by 2nd Grade
In terms of 2nd grade, the demographic groups most similar to Immigrants are Immigrants from Grenada (97.1%, a difference of 0.040%), Malaysian (97.1%, a difference of 0.060%), Immigrants from Cuba (97.0%, a difference of 0.060%), Immigrants from Dominica (97.0%, a difference of 0.070%), and Haitian (97.0%, a difference of 0.070%).
| Demographics | Rating | Rank | 2nd Grade |
| Houma | 0.0 /100 | #289 | Tragic 97.2% |
| Immigrants | St. Vincent and the Grenadines | 0.0 /100 | #290 | Tragic 97.2% |
| Immigrants | Afghanistan | 0.0 /100 | #291 | Tragic 97.2% |
| Immigrants | Eritrea | 0.0 /100 | #292 | Tragic 97.2% |
| British West Indians | 0.0 /100 | #293 | Tragic 97.2% |
| Malaysians | 0.0 /100 | #294 | Tragic 97.1% |
| Immigrants | Grenada | 0.0 /100 | #295 | Tragic 97.1% |
| Immigrants | Immigrants | 0.0 /100 | #296 | Tragic 97.1% |
| Immigrants | Cuba | 0.0 /100 | #297 | Tragic 97.0% |
| Immigrants | Dominica | 0.0 /100 | #298 | Tragic 97.0% |
| Haitians | 0.0 /100 | #299 | Tragic 97.0% |
| Immigrants | South Eastern Asia | 0.0 /100 | #300 | Tragic 97.0% |
| Central American Indians | 0.0 /100 | #301 | Tragic 97.0% |
| Somalis | 0.0 /100 | #302 | Tragic 97.0% |
| Ecuadorians | 0.0 /100 | #303 | Tragic 96.9% |
Demographics Similar to Immigrants from India by 2nd Grade
In terms of 2nd grade, the demographic groups most similar to Immigrants from India are Zimbabwean (98.2%, a difference of 0.0%), Immigrants from Western Europe (98.2%, a difference of 0.0%), Immigrants from South Africa (98.2%, a difference of 0.0%), Macedonian (98.2%, a difference of 0.010%), and Ukrainian (98.2%, a difference of 0.010%).
| Demographics | Rating | Rank | 2nd Grade |
| Immigrants | Australia | 99.0 /100 | #86 | Exceptional 98.2% |
| Immigrants | Denmark | 99.0 /100 | #87 | Exceptional 98.2% |
| Macedonians | 99.0 /100 | #88 | Exceptional 98.2% |
| Ukrainians | 98.9 /100 | #89 | Exceptional 98.2% |
| Zimbabweans | 98.8 /100 | #90 | Exceptional 98.2% |
| Immigrants | Western Europe | 98.8 /100 | #91 | Exceptional 98.2% |
| Immigrants | South Africa | 98.8 /100 | #92 | Exceptional 98.2% |
| Immigrants | India | 98.8 /100 | #93 | Exceptional 98.2% |
| Immigrants | Germany | 98.6 /100 | #94 | Exceptional 98.2% |
| South Africans | 98.6 /100 | #95 | Exceptional 98.2% |
| Cypriots | 98.4 /100 | #96 | Exceptional 98.2% |
| Choctaw | 98.3 /100 | #97 | Exceptional 98.2% |
| Immigrants | Nonimmigrants | 98.3 /100 | #98 | Exceptional 98.2% |
| Immigrants | Ireland | 98.0 /100 | #99 | Exceptional 98.2% |
| Romanians | 98.0 /100 | #100 | Exceptional 98.2% |