Immigrants from Romania vs West Indian 2nd Grade
COMPARE
Immigrants from Romania
West Indian
2nd Grade
2nd Grade Comparison
Immigrants from Romania
West Indians
98.0%
2ND GRADE
88.3/ 100
METRIC RATING
137th/ 347
METRIC RANK
97.4%
2ND GRADE
0.3/ 100
METRIC RATING
269th/ 347
METRIC RANK
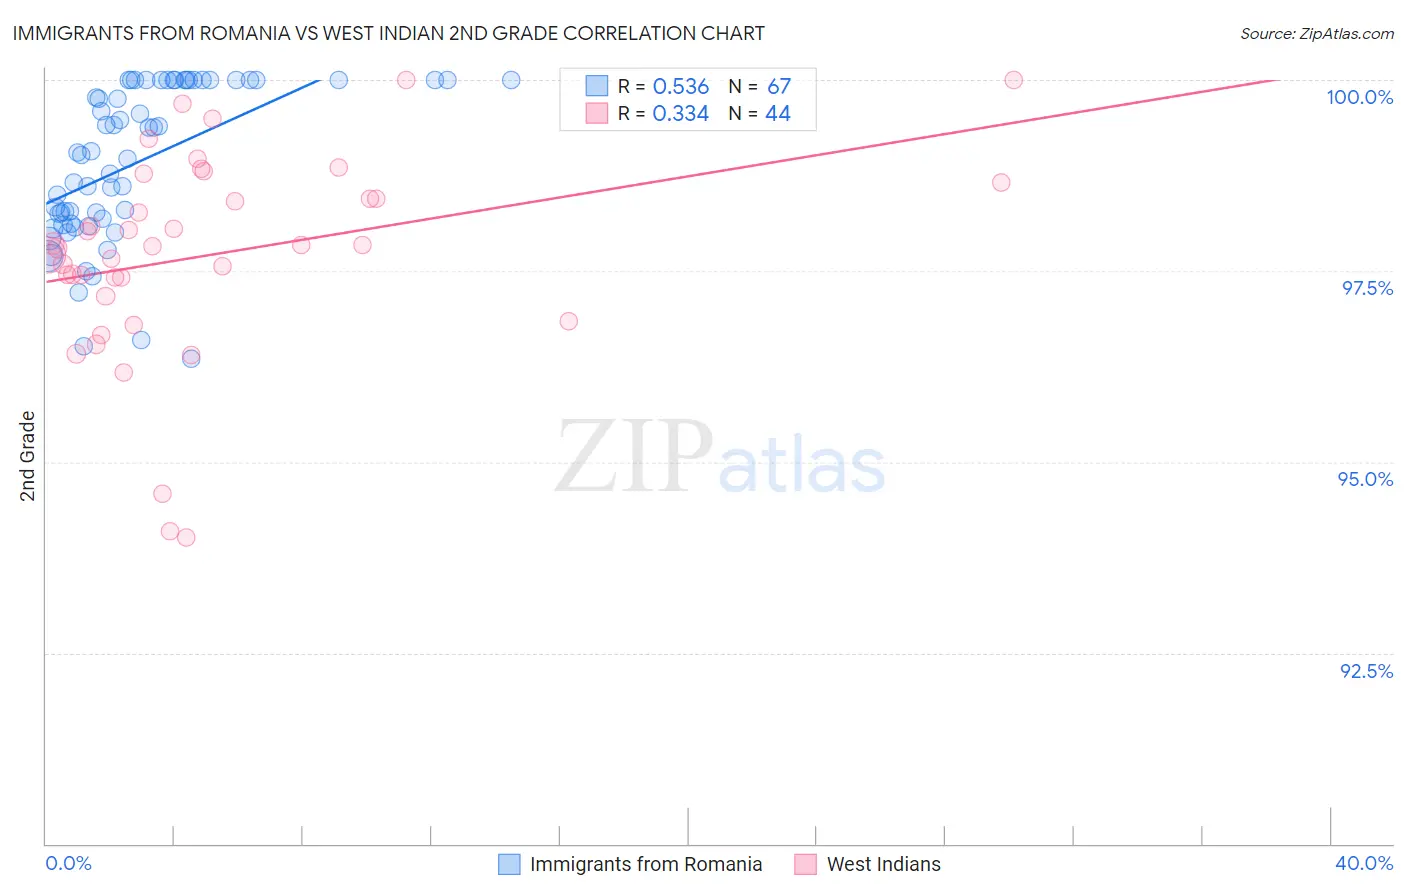
Immigrants from Romania vs West Indian 2nd Grade Correlation Chart
The statistical analysis conducted on geographies consisting of 257,006,599 people shows a substantial positive correlation between the proportion of Immigrants from Romania and percentage of population with at least 2nd grade education in the United States with a correlation coefficient (R) of 0.536 and weighted average of 98.0%. Similarly, the statistical analysis conducted on geographies consisting of 254,063,654 people shows a mild positive correlation between the proportion of West Indians and percentage of population with at least 2nd grade education in the United States with a correlation coefficient (R) of 0.334 and weighted average of 97.4%, a difference of 0.63%.
2nd Grade Correlation Summary
| Measurement | Immigrants from Romania | West Indian |
| Minimum | 96.4% | 94.0% |
| Maximum | 100.0% | 100.0% |
| Range | 3.6% | 6.0% |
| Mean | 98.9% | 97.7% |
| Median | 99.1% | 97.8% |
| Interquartile 25% (IQ1) | 98.1% | 97.3% |
| Interquartile 75% (IQ3) | 100.0% | 98.5% |
| Interquartile Range (IQR) | 1.9% | 1.3% |
| Standard Deviation (Sample) | 1.0% | 1.3% |
| Standard Deviation (Population) | 1.0% | 1.3% |
Similar Demographics by 2nd Grade
Demographics Similar to Immigrants from Romania by 2nd Grade
In terms of 2nd grade, the demographic groups most similar to Immigrants from Romania are Israeli (98.0%, a difference of 0.0%), Immigrants from Hungary (98.0%, a difference of 0.010%), Immigrants from Bulgaria (98.0%, a difference of 0.010%), Immigrants from Kuwait (98.0%, a difference of 0.010%), and Blackfeet (98.0%, a difference of 0.010%).
| Demographics | Rating | Rank | 2nd Grade |
| Seminole | 91.1 /100 | #130 | Exceptional 98.0% |
| Immigrants | Europe | 91.1 /100 | #131 | Exceptional 98.0% |
| Spaniards | 90.7 /100 | #132 | Exceptional 98.0% |
| Cambodians | 90.7 /100 | #133 | Exceptional 98.0% |
| Immigrants | Hungary | 89.7 /100 | #134 | Excellent 98.0% |
| Immigrants | Bulgaria | 89.7 /100 | #135 | Excellent 98.0% |
| Immigrants | Kuwait | 89.2 /100 | #136 | Excellent 98.0% |
| Immigrants | Romania | 88.3 /100 | #137 | Excellent 98.0% |
| Israelis | 87.9 /100 | #138 | Excellent 98.0% |
| Blackfeet | 87.5 /100 | #139 | Excellent 98.0% |
| Palestinians | 83.9 /100 | #140 | Excellent 98.0% |
| Immigrants | Turkey | 83.0 /100 | #141 | Excellent 98.0% |
| Burmese | 81.0 /100 | #142 | Excellent 98.0% |
| Alsatians | 80.5 /100 | #143 | Excellent 98.0% |
| Hmong | 80.0 /100 | #144 | Good 98.0% |
Demographics Similar to West Indians by 2nd Grade
In terms of 2nd grade, the demographic groups most similar to West Indians are Immigrants from Nigeria (97.4%, a difference of 0.0%), Cuban (97.4%, a difference of 0.010%), Immigrants from Sierra Leone (97.4%, a difference of 0.020%), Immigrants from Jamaica (97.4%, a difference of 0.020%), and Taiwanese (97.4%, a difference of 0.030%).
| Demographics | Rating | Rank | 2nd Grade |
| Taiwanese | 0.4 /100 | #262 | Tragic 97.4% |
| Immigrants | Ethiopia | 0.4 /100 | #263 | Tragic 97.4% |
| Immigrants | Liberia | 0.4 /100 | #264 | Tragic 97.4% |
| Immigrants | South America | 0.4 /100 | #265 | Tragic 97.4% |
| Immigrants | Sierra Leone | 0.4 /100 | #266 | Tragic 97.4% |
| Cubans | 0.3 /100 | #267 | Tragic 97.4% |
| Immigrants | Nigeria | 0.3 /100 | #268 | Tragic 97.4% |
| West Indians | 0.3 /100 | #269 | Tragic 97.4% |
| Immigrants | Jamaica | 0.2 /100 | #270 | Tragic 97.4% |
| Immigrants | Cameroon | 0.2 /100 | #271 | Tragic 97.4% |
| Immigrants | Peru | 0.1 /100 | #272 | Tragic 97.4% |
| Immigrants | Bolivia | 0.1 /100 | #273 | Tragic 97.4% |
| Ghanaians | 0.1 /100 | #274 | Tragic 97.4% |
| Immigrants | China | 0.1 /100 | #275 | Tragic 97.3% |
| Immigrants | Philippines | 0.1 /100 | #276 | Tragic 97.3% |