Immigrants vs Croatian 2nd Grade
COMPARE
Immigrants
Croatian
2nd Grade
2nd Grade Comparison
Immigrants
Croatians
97.1%
2ND GRADE
0.0/ 100
METRIC RATING
296th/ 347
METRIC RANK
98.5%
2ND GRADE
100.0/ 100
METRIC RATING
27th/ 347
METRIC RANK
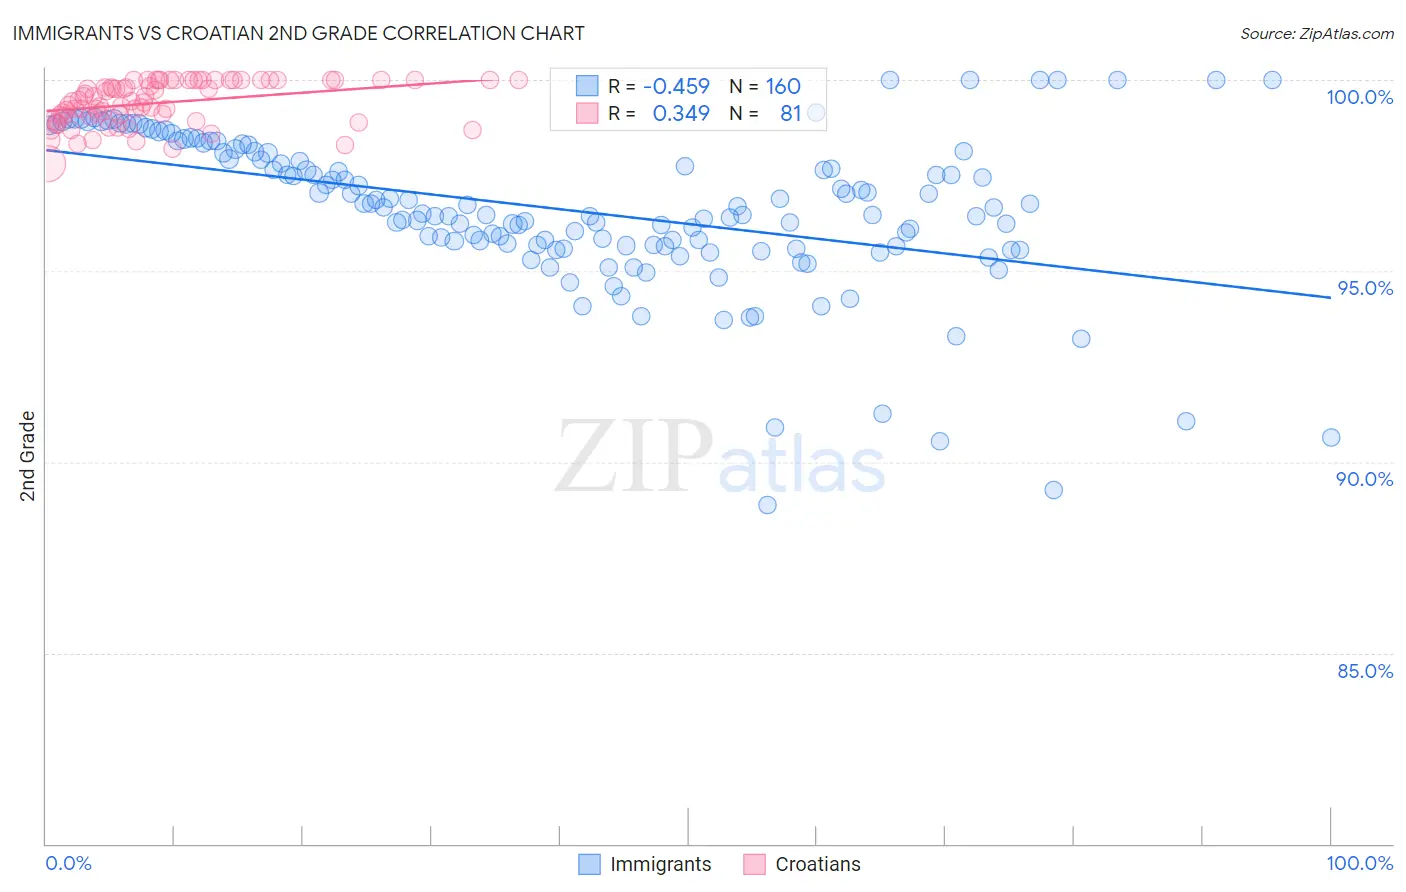
Immigrants vs Croatian 2nd Grade Correlation Chart
The statistical analysis conducted on geographies consisting of 577,788,049 people shows a moderate negative correlation between the proportion of Immigrants and percentage of population with at least 2nd grade education in the United States with a correlation coefficient (R) of -0.459 and weighted average of 97.1%. Similarly, the statistical analysis conducted on geographies consisting of 375,731,938 people shows a mild positive correlation between the proportion of Croatians and percentage of population with at least 2nd grade education in the United States with a correlation coefficient (R) of 0.349 and weighted average of 98.5%, a difference of 1.5%.
2nd Grade Correlation Summary
| Measurement | Immigrants | Croatian |
| Minimum | 88.9% | 97.8% |
| Maximum | 100.0% | 100.0% |
| Range | 11.1% | 2.2% |
| Mean | 96.6% | 99.4% |
| Median | 96.6% | 99.4% |
| Interquartile 25% (IQ1) | 95.7% | 99.0% |
| Interquartile 75% (IQ3) | 98.1% | 100.0% |
| Interquartile Range (IQR) | 2.5% | 0.96% |
| Standard Deviation (Sample) | 2.0% | 0.56% |
| Standard Deviation (Population) | 2.0% | 0.56% |
Similar Demographics by 2nd Grade
Demographics Similar to Immigrants by 2nd Grade
In terms of 2nd grade, the demographic groups most similar to Immigrants are Immigrants from Grenada (97.1%, a difference of 0.040%), Malaysian (97.1%, a difference of 0.060%), Immigrants from Cuba (97.0%, a difference of 0.060%), Immigrants from Dominica (97.0%, a difference of 0.070%), and Haitian (97.0%, a difference of 0.070%).
| Demographics | Rating | Rank | 2nd Grade |
| Houma | 0.0 /100 | #289 | Tragic 97.2% |
| Immigrants | St. Vincent and the Grenadines | 0.0 /100 | #290 | Tragic 97.2% |
| Immigrants | Afghanistan | 0.0 /100 | #291 | Tragic 97.2% |
| Immigrants | Eritrea | 0.0 /100 | #292 | Tragic 97.2% |
| British West Indians | 0.0 /100 | #293 | Tragic 97.2% |
| Malaysians | 0.0 /100 | #294 | Tragic 97.1% |
| Immigrants | Grenada | 0.0 /100 | #295 | Tragic 97.1% |
| Immigrants | Immigrants | 0.0 /100 | #296 | Tragic 97.1% |
| Immigrants | Cuba | 0.0 /100 | #297 | Tragic 97.0% |
| Immigrants | Dominica | 0.0 /100 | #298 | Tragic 97.0% |
| Haitians | 0.0 /100 | #299 | Tragic 97.0% |
| Immigrants | South Eastern Asia | 0.0 /100 | #300 | Tragic 97.0% |
| Central American Indians | 0.0 /100 | #301 | Tragic 97.0% |
| Somalis | 0.0 /100 | #302 | Tragic 97.0% |
| Ecuadorians | 0.0 /100 | #303 | Tragic 96.9% |
Demographics Similar to Croatians by 2nd Grade
In terms of 2nd grade, the demographic groups most similar to Croatians are Arapaho (98.5%, a difference of 0.0%), Welsh (98.5%, a difference of 0.010%), French (98.5%, a difference of 0.010%), European (98.5%, a difference of 0.010%), and Sioux (98.5%, a difference of 0.020%).
| Demographics | Rating | Rank | 2nd Grade |
| Sioux | 100.0 /100 | #20 | Exceptional 98.5% |
| Lithuanians | 100.0 /100 | #21 | Exceptional 98.5% |
| Poles | 100.0 /100 | #22 | Exceptional 98.5% |
| Danes | 100.0 /100 | #23 | Exceptional 98.5% |
| Pennsylvania Germans | 100.0 /100 | #24 | Exceptional 98.5% |
| Scotch-Irish | 100.0 /100 | #25 | Exceptional 98.5% |
| Welsh | 100.0 /100 | #26 | Exceptional 98.5% |
| Croatians | 100.0 /100 | #27 | Exceptional 98.5% |
| Arapaho | 100.0 /100 | #28 | Exceptional 98.5% |
| French | 100.0 /100 | #29 | Exceptional 98.5% |
| Europeans | 100.0 /100 | #30 | Exceptional 98.5% |
| Czechs | 100.0 /100 | #31 | Exceptional 98.5% |
| French Canadians | 100.0 /100 | #32 | Exceptional 98.5% |
| Scandinavians | 100.0 /100 | #33 | Exceptional 98.5% |
| Chinese | 100.0 /100 | #34 | Exceptional 98.5% |