Immigrants vs U.S. Virgin Islander 9th Grade
COMPARE
Immigrants
U.S. Virgin Islander
9th Grade
9th Grade Comparison
Immigrants
U.S. Virgin Islanders
92.5%
9TH GRADE
0.0/ 100
METRIC RATING
307th/ 347
METRIC RANK
94.0%
9TH GRADE
0.7/ 100
METRIC RATING
254th/ 347
METRIC RANK
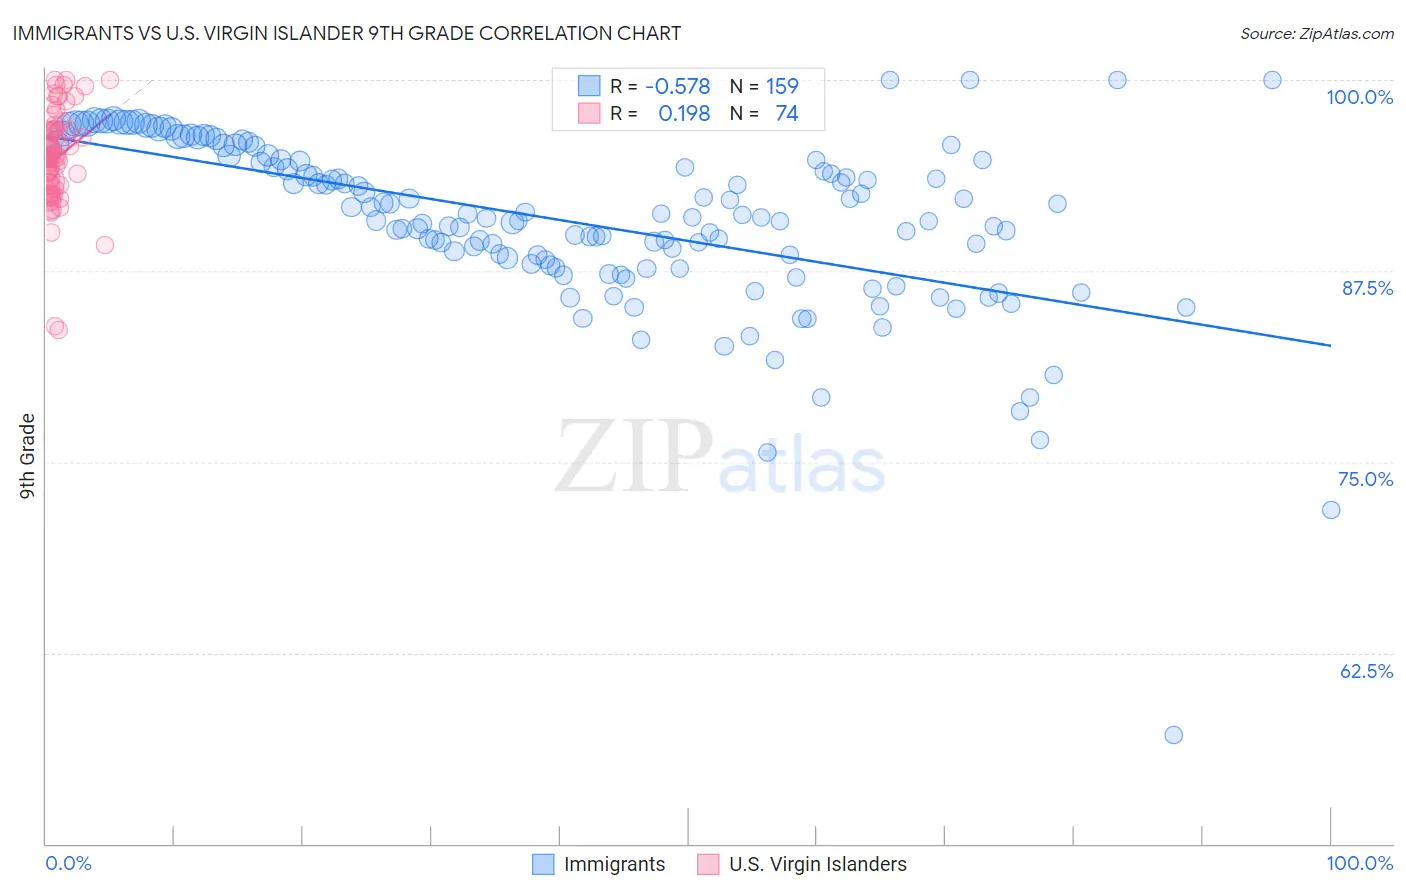
Immigrants vs U.S. Virgin Islander 9th Grade Correlation Chart
The statistical analysis conducted on geographies consisting of 577,786,659 people shows a substantial negative correlation between the proportion of Immigrants and percentage of population with at least 9th grade education in the United States with a correlation coefficient (R) of -0.578 and weighted average of 92.5%. Similarly, the statistical analysis conducted on geographies consisting of 87,529,315 people shows a poor positive correlation between the proportion of U.S. Virgin Islanders and percentage of population with at least 9th grade education in the United States with a correlation coefficient (R) of 0.198 and weighted average of 94.0%, a difference of 1.6%.
9th Grade Correlation Summary
| Measurement | Immigrants | U.S. Virgin Islander |
| Minimum | 57.2% | 83.6% |
| Maximum | 100.0% | 100.0% |
| Range | 42.8% | 16.4% |
| Mean | 90.8% | 94.9% |
| Median | 91.0% | 94.9% |
| Interquartile 25% (IQ1) | 88.0% | 93.1% |
| Interquartile 75% (IQ3) | 94.8% | 96.7% |
| Interquartile Range (IQR) | 6.8% | 3.7% |
| Standard Deviation (Sample) | 5.7% | 3.2% |
| Standard Deviation (Population) | 5.7% | 3.2% |
Similar Demographics by 9th Grade
Demographics Similar to Immigrants by 9th Grade
In terms of 9th grade, the demographic groups most similar to Immigrants are Immigrants from Guyana (92.5%, a difference of 0.010%), Japanese (92.6%, a difference of 0.10%), Immigrants from Vietnam (92.6%, a difference of 0.10%), Tohono O'odham (92.6%, a difference of 0.12%), and Guyanese (92.7%, a difference of 0.14%).
| Demographics | Rating | Rank | 9th Grade |
| Yaqui | 0.0 /100 | #300 | Tragic 92.9% |
| Immigrants | Haiti | 0.0 /100 | #301 | Tragic 92.7% |
| Immigrants | Dominica | 0.0 /100 | #302 | Tragic 92.7% |
| Guyanese | 0.0 /100 | #303 | Tragic 92.7% |
| Tohono O'odham | 0.0 /100 | #304 | Tragic 92.6% |
| Japanese | 0.0 /100 | #305 | Tragic 92.6% |
| Immigrants | Vietnam | 0.0 /100 | #306 | Tragic 92.6% |
| Immigrants | Immigrants | 0.0 /100 | #307 | Tragic 92.5% |
| Immigrants | Guyana | 0.0 /100 | #308 | Tragic 92.5% |
| Immigrants | Bangladesh | 0.0 /100 | #309 | Tragic 92.4% |
| Immigrants | Cambodia | 0.0 /100 | #310 | Tragic 92.4% |
| Immigrants | Fiji | 0.0 /100 | #311 | Tragic 92.3% |
| Houma | 0.0 /100 | #312 | Tragic 92.3% |
| Vietnamese | 0.0 /100 | #313 | Tragic 92.3% |
| Immigrants | Portugal | 0.0 /100 | #314 | Tragic 92.2% |
Demographics Similar to U.S. Virgin Islanders by 9th Grade
In terms of 9th grade, the demographic groups most similar to U.S. Virgin Islanders are Colombian (94.0%, a difference of 0.030%), Immigrants from Senegal (94.1%, a difference of 0.050%), Immigrants from Nigeria (94.0%, a difference of 0.050%), Jamaican (94.1%, a difference of 0.060%), and Immigrants from Afghanistan (94.0%, a difference of 0.060%).
| Demographics | Rating | Rank | 9th Grade |
| Afghans | 1.8 /100 | #247 | Tragic 94.2% |
| Immigrants | Somalia | 1.4 /100 | #248 | Tragic 94.1% |
| Uruguayans | 1.3 /100 | #249 | Tragic 94.1% |
| Immigrants | Hong Kong | 1.3 /100 | #250 | Tragic 94.1% |
| Jamaicans | 1.0 /100 | #251 | Tragic 94.1% |
| Immigrants | Senegal | 0.9 /100 | #252 | Tragic 94.1% |
| Colombians | 0.8 /100 | #253 | Tragic 94.0% |
| U.S. Virgin Islanders | 0.7 /100 | #254 | Tragic 94.0% |
| Immigrants | Nigeria | 0.6 /100 | #255 | Tragic 94.0% |
| Immigrants | Afghanistan | 0.5 /100 | #256 | Tragic 94.0% |
| Immigrants | Costa Rica | 0.5 /100 | #257 | Tragic 94.0% |
| Immigrants | Thailand | 0.5 /100 | #258 | Tragic 93.9% |
| Ghanaians | 0.5 /100 | #259 | Tragic 93.9% |
| Pima | 0.4 /100 | #260 | Tragic 93.9% |
| South Americans | 0.4 /100 | #261 | Tragic 93.9% |