Immigrants from Romania vs U.S. Virgin Islander 9th Grade
COMPARE
Immigrants from Romania
U.S. Virgin Islander
9th Grade
9th Grade Comparison
Immigrants from Romania
U.S. Virgin Islanders
95.4%
9TH GRADE
95.6/ 100
METRIC RATING
117th/ 347
METRIC RANK
94.0%
9TH GRADE
0.7/ 100
METRIC RATING
254th/ 347
METRIC RANK
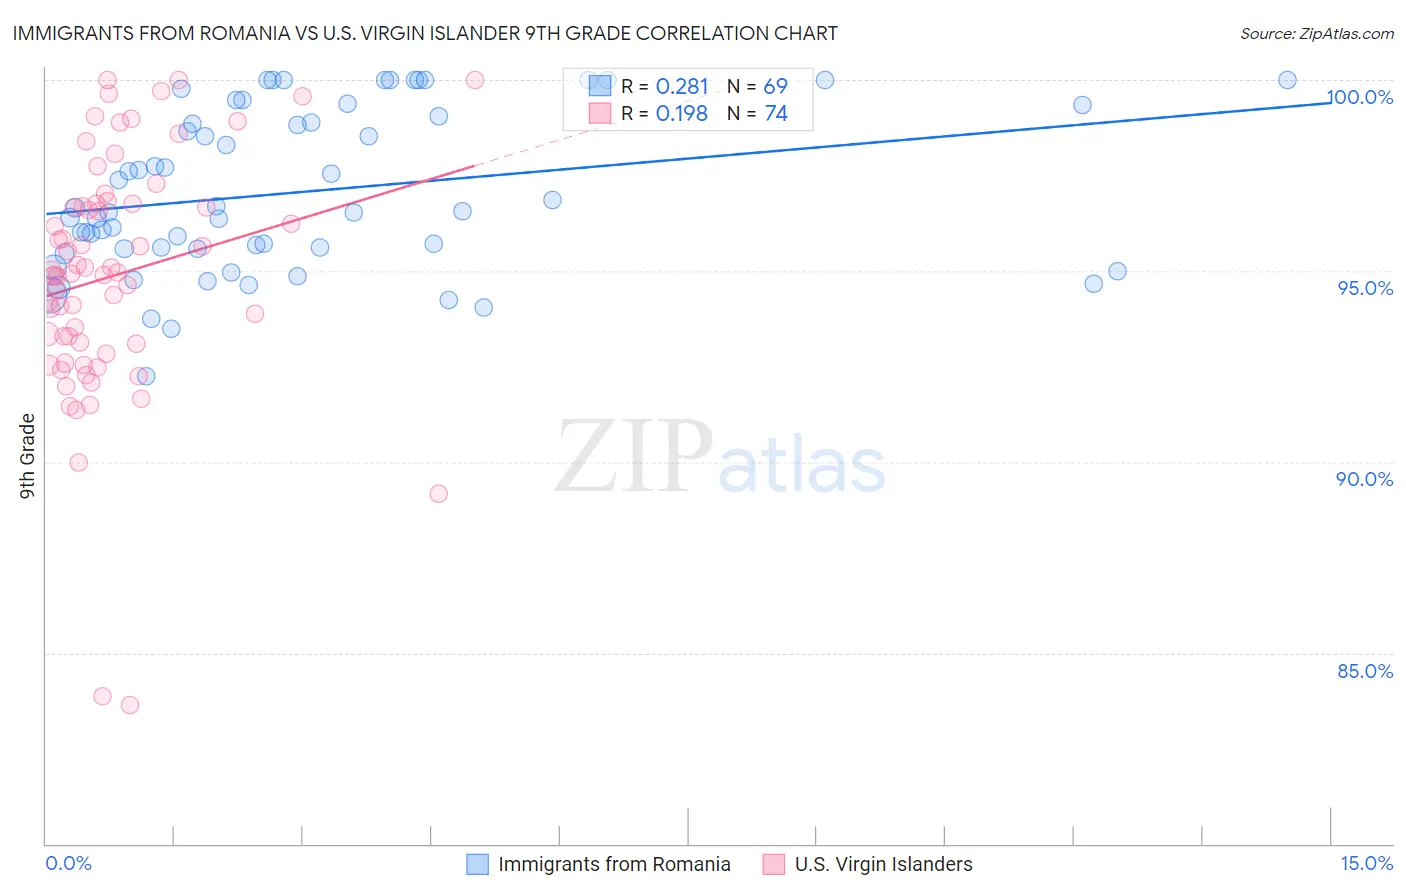
Immigrants from Romania vs U.S. Virgin Islander 9th Grade Correlation Chart
The statistical analysis conducted on geographies consisting of 257,008,799 people shows a weak positive correlation between the proportion of Immigrants from Romania and percentage of population with at least 9th grade education in the United States with a correlation coefficient (R) of 0.281 and weighted average of 95.4%. Similarly, the statistical analysis conducted on geographies consisting of 87,529,315 people shows a poor positive correlation between the proportion of U.S. Virgin Islanders and percentage of population with at least 9th grade education in the United States with a correlation coefficient (R) of 0.198 and weighted average of 94.0%, a difference of 1.5%.
9th Grade Correlation Summary
| Measurement | Immigrants from Romania | U.S. Virgin Islander |
| Minimum | 92.3% | 83.6% |
| Maximum | 100.0% | 100.0% |
| Range | 7.7% | 16.4% |
| Mean | 97.1% | 94.9% |
| Median | 96.6% | 94.9% |
| Interquartile 25% (IQ1) | 95.6% | 93.1% |
| Interquartile 75% (IQ3) | 99.2% | 96.7% |
| Interquartile Range (IQR) | 3.6% | 3.7% |
| Standard Deviation (Sample) | 2.1% | 3.2% |
| Standard Deviation (Population) | 2.1% | 3.2% |
Similar Demographics by 9th Grade
Demographics Similar to Immigrants from Romania by 9th Grade
In terms of 9th grade, the demographic groups most similar to Immigrants from Romania are Immigrants from Europe (95.4%, a difference of 0.0%), Immigrants from Turkey (95.4%, a difference of 0.0%), Soviet Union (95.4%, a difference of 0.0%), Cambodian (95.4%, a difference of 0.0%), and Cree (95.4%, a difference of 0.0%).
| Demographics | Rating | Rank | 9th Grade |
| Immigrants | Bulgaria | 96.7 /100 | #110 | Exceptional 95.5% |
| Cherokee | 96.3 /100 | #111 | Exceptional 95.4% |
| Immigrants | Croatia | 96.2 /100 | #112 | Exceptional 95.4% |
| Iroquois | 96.2 /100 | #113 | Exceptional 95.4% |
| German Russians | 96.1 /100 | #114 | Exceptional 95.4% |
| Burmese | 96.0 /100 | #115 | Exceptional 95.4% |
| Immigrants | Europe | 95.7 /100 | #116 | Exceptional 95.4% |
| Immigrants | Romania | 95.6 /100 | #117 | Exceptional 95.4% |
| Immigrants | Turkey | 95.6 /100 | #118 | Exceptional 95.4% |
| Soviet Union | 95.6 /100 | #119 | Exceptional 95.4% |
| Cambodians | 95.6 /100 | #120 | Exceptional 95.4% |
| Cree | 95.5 /100 | #121 | Exceptional 95.4% |
| Immigrants | Kuwait | 95.5 /100 | #122 | Exceptional 95.4% |
| Kiowa | 95.3 /100 | #123 | Exceptional 95.4% |
| Shoshone | 95.3 /100 | #124 | Exceptional 95.4% |
Demographics Similar to U.S. Virgin Islanders by 9th Grade
In terms of 9th grade, the demographic groups most similar to U.S. Virgin Islanders are Colombian (94.0%, a difference of 0.030%), Immigrants from Senegal (94.1%, a difference of 0.050%), Immigrants from Nigeria (94.0%, a difference of 0.050%), Jamaican (94.1%, a difference of 0.060%), and Immigrants from Afghanistan (94.0%, a difference of 0.060%).
| Demographics | Rating | Rank | 9th Grade |
| Afghans | 1.8 /100 | #247 | Tragic 94.2% |
| Immigrants | Somalia | 1.4 /100 | #248 | Tragic 94.1% |
| Uruguayans | 1.3 /100 | #249 | Tragic 94.1% |
| Immigrants | Hong Kong | 1.3 /100 | #250 | Tragic 94.1% |
| Jamaicans | 1.0 /100 | #251 | Tragic 94.1% |
| Immigrants | Senegal | 0.9 /100 | #252 | Tragic 94.1% |
| Colombians | 0.8 /100 | #253 | Tragic 94.0% |
| U.S. Virgin Islanders | 0.7 /100 | #254 | Tragic 94.0% |
| Immigrants | Nigeria | 0.6 /100 | #255 | Tragic 94.0% |
| Immigrants | Afghanistan | 0.5 /100 | #256 | Tragic 94.0% |
| Immigrants | Costa Rica | 0.5 /100 | #257 | Tragic 94.0% |
| Immigrants | Thailand | 0.5 /100 | #258 | Tragic 93.9% |
| Ghanaians | 0.5 /100 | #259 | Tragic 93.9% |
| Pima | 0.4 /100 | #260 | Tragic 93.9% |
| South Americans | 0.4 /100 | #261 | Tragic 93.9% |