Swiss vs U.S. Virgin Islander 9th Grade
COMPARE
Swiss
U.S. Virgin Islander
9th Grade
9th Grade Comparison
Swiss
U.S. Virgin Islanders
95.7%
9TH GRADE
99.2/ 100
METRIC RATING
83rd/ 347
METRIC RANK
94.0%
9TH GRADE
0.7/ 100
METRIC RATING
254th/ 347
METRIC RANK
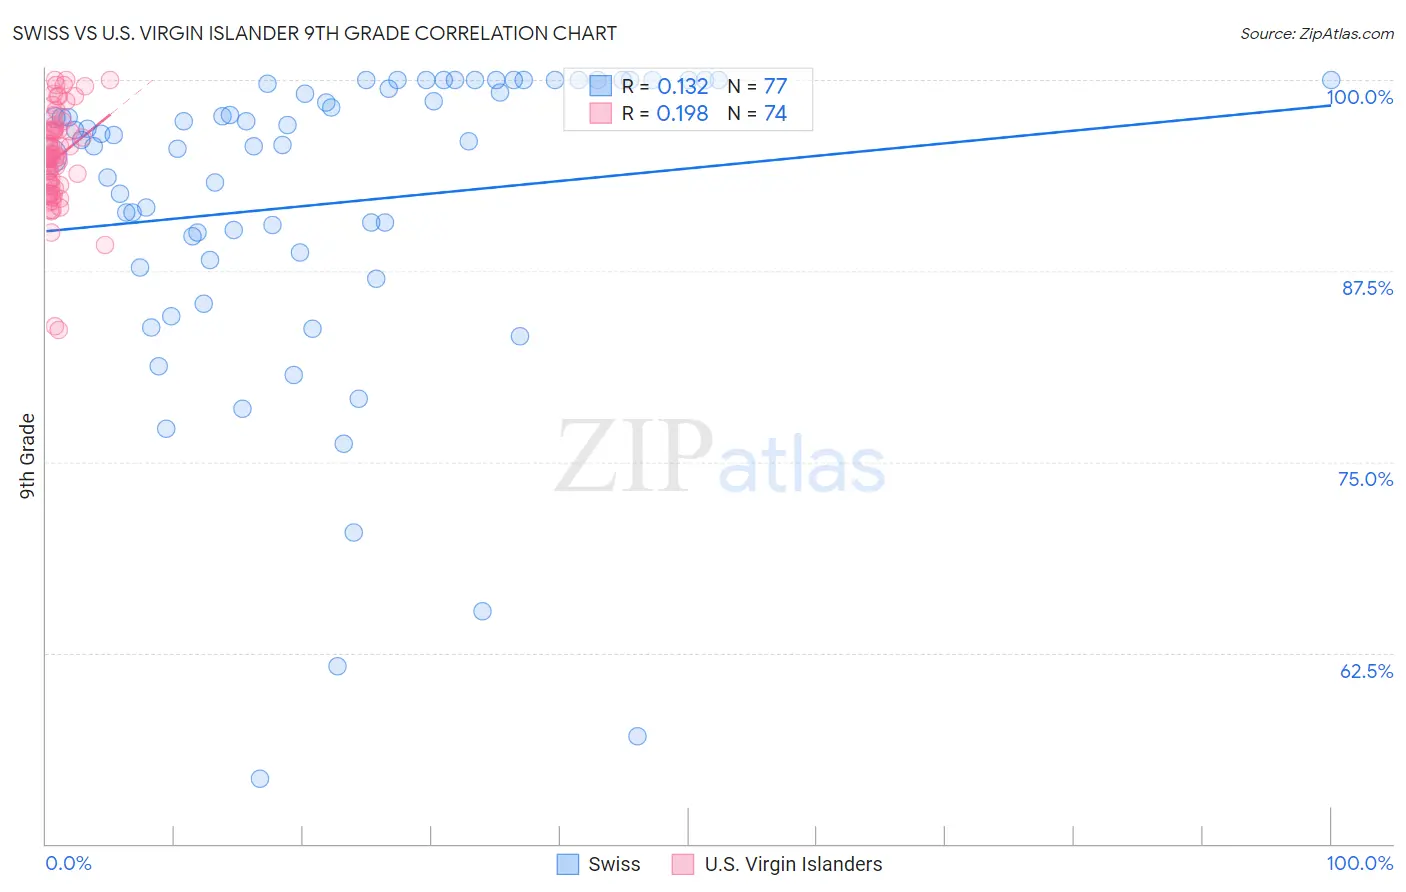
Swiss vs U.S. Virgin Islander 9th Grade Correlation Chart
The statistical analysis conducted on geographies consisting of 465,022,424 people shows a poor positive correlation between the proportion of Swiss and percentage of population with at least 9th grade education in the United States with a correlation coefficient (R) of 0.132 and weighted average of 95.7%. Similarly, the statistical analysis conducted on geographies consisting of 87,529,315 people shows a poor positive correlation between the proportion of U.S. Virgin Islanders and percentage of population with at least 9th grade education in the United States with a correlation coefficient (R) of 0.198 and weighted average of 94.0%, a difference of 1.8%.
9th Grade Correlation Summary
| Measurement | Swiss | U.S. Virgin Islander |
| Minimum | 54.2% | 83.6% |
| Maximum | 100.0% | 100.0% |
| Range | 45.8% | 16.4% |
| Mean | 91.9% | 94.9% |
| Median | 96.1% | 94.9% |
| Interquartile 25% (IQ1) | 88.4% | 93.1% |
| Interquartile 75% (IQ3) | 99.9% | 96.7% |
| Interquartile Range (IQR) | 11.4% | 3.7% |
| Standard Deviation (Sample) | 10.4% | 3.2% |
| Standard Deviation (Population) | 10.3% | 3.2% |
Similar Demographics by 9th Grade
Demographics Similar to Swiss by 9th Grade
In terms of 9th grade, the demographic groups most similar to Swiss are Immigrants from Denmark (95.7%, a difference of 0.010%), Icelander (95.7%, a difference of 0.010%), Immigrants from Western Europe (95.7%, a difference of 0.010%), Bhutanese (95.7%, a difference of 0.020%), and Arapaho (95.7%, a difference of 0.020%).
| Demographics | Rating | Rank | 9th Grade |
| Immigrants | Sweden | 99.5 /100 | #76 | Exceptional 95.8% |
| Whites/Caucasians | 99.4 /100 | #77 | Exceptional 95.8% |
| Immigrants | South Africa | 99.4 /100 | #78 | Exceptional 95.8% |
| Romanians | 99.3 /100 | #79 | Exceptional 95.7% |
| Bhutanese | 99.3 /100 | #80 | Exceptional 95.7% |
| Arapaho | 99.3 /100 | #81 | Exceptional 95.7% |
| Puget Sound Salish | 99.2 /100 | #82 | Exceptional 95.7% |
| Swiss | 99.2 /100 | #83 | Exceptional 95.7% |
| Immigrants | Denmark | 99.1 /100 | #84 | Exceptional 95.7% |
| Icelanders | 99.1 /100 | #85 | Exceptional 95.7% |
| Immigrants | Western Europe | 99.1 /100 | #86 | Exceptional 95.7% |
| Okinawans | 99.0 /100 | #87 | Exceptional 95.7% |
| Immigrants | Czechoslovakia | 98.9 /100 | #88 | Exceptional 95.7% |
| Yugoslavians | 98.9 /100 | #89 | Exceptional 95.7% |
| South Africans | 98.8 /100 | #90 | Exceptional 95.6% |
Demographics Similar to U.S. Virgin Islanders by 9th Grade
In terms of 9th grade, the demographic groups most similar to U.S. Virgin Islanders are Colombian (94.0%, a difference of 0.030%), Immigrants from Senegal (94.1%, a difference of 0.050%), Immigrants from Nigeria (94.0%, a difference of 0.050%), Jamaican (94.1%, a difference of 0.060%), and Immigrants from Afghanistan (94.0%, a difference of 0.060%).
| Demographics | Rating | Rank | 9th Grade |
| Afghans | 1.8 /100 | #247 | Tragic 94.2% |
| Immigrants | Somalia | 1.4 /100 | #248 | Tragic 94.1% |
| Uruguayans | 1.3 /100 | #249 | Tragic 94.1% |
| Immigrants | Hong Kong | 1.3 /100 | #250 | Tragic 94.1% |
| Jamaicans | 1.0 /100 | #251 | Tragic 94.1% |
| Immigrants | Senegal | 0.9 /100 | #252 | Tragic 94.1% |
| Colombians | 0.8 /100 | #253 | Tragic 94.0% |
| U.S. Virgin Islanders | 0.7 /100 | #254 | Tragic 94.0% |
| Immigrants | Nigeria | 0.6 /100 | #255 | Tragic 94.0% |
| Immigrants | Afghanistan | 0.5 /100 | #256 | Tragic 94.0% |
| Immigrants | Costa Rica | 0.5 /100 | #257 | Tragic 94.0% |
| Immigrants | Thailand | 0.5 /100 | #258 | Tragic 93.9% |
| Ghanaians | 0.5 /100 | #259 | Tragic 93.9% |
| Pima | 0.4 /100 | #260 | Tragic 93.9% |
| South Americans | 0.4 /100 | #261 | Tragic 93.9% |