Guamanian/Chamorro vs U.S. Virgin Islander 9th Grade
COMPARE
Guamanian/Chamorro
U.S. Virgin Islander
9th Grade
9th Grade Comparison
Guamanians/Chamorros
U.S. Virgin Islanders
94.8%
9TH GRADE
35.5/ 100
METRIC RATING
187th/ 347
METRIC RANK
94.0%
9TH GRADE
0.7/ 100
METRIC RATING
254th/ 347
METRIC RANK
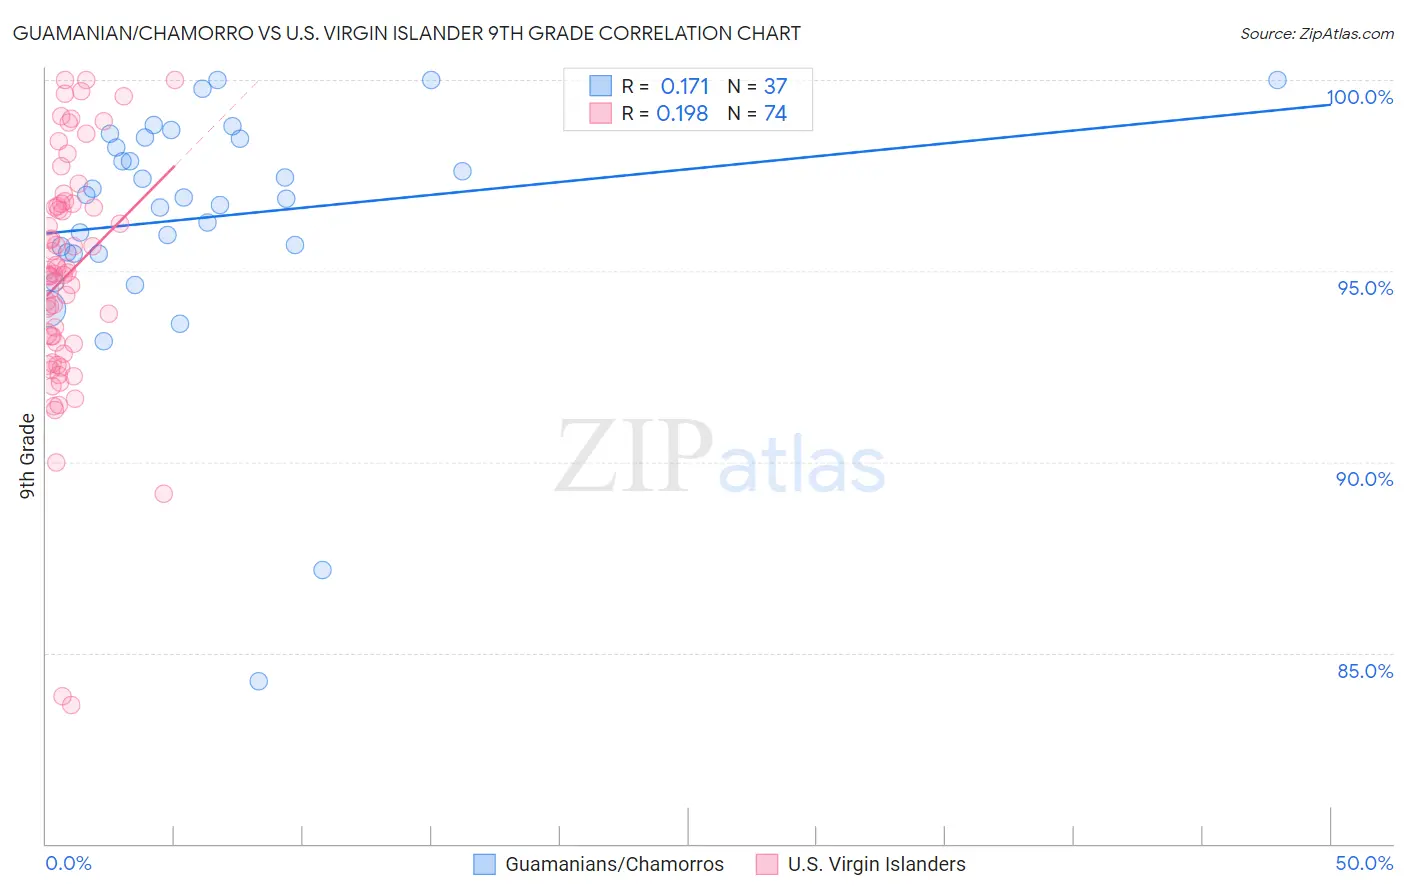
Guamanian/Chamorro vs U.S. Virgin Islander 9th Grade Correlation Chart
The statistical analysis conducted on geographies consisting of 221,965,618 people shows a poor positive correlation between the proportion of Guamanians/Chamorros and percentage of population with at least 9th grade education in the United States with a correlation coefficient (R) of 0.171 and weighted average of 94.8%. Similarly, the statistical analysis conducted on geographies consisting of 87,529,315 people shows a poor positive correlation between the proportion of U.S. Virgin Islanders and percentage of population with at least 9th grade education in the United States with a correlation coefficient (R) of 0.198 and weighted average of 94.0%, a difference of 0.80%.
9th Grade Correlation Summary
| Measurement | Guamanian/Chamorro | U.S. Virgin Islander |
| Minimum | 84.3% | 83.6% |
| Maximum | 100.0% | 100.0% |
| Range | 15.7% | 16.4% |
| Mean | 96.4% | 94.9% |
| Median | 96.9% | 94.9% |
| Interquartile 25% (IQ1) | 95.5% | 93.1% |
| Interquartile 75% (IQ3) | 98.5% | 96.7% |
| Interquartile Range (IQR) | 3.0% | 3.7% |
| Standard Deviation (Sample) | 3.2% | 3.2% |
| Standard Deviation (Population) | 3.1% | 3.2% |
Similar Demographics by 9th Grade
Demographics Similar to Guamanians/Chamorros by 9th Grade
In terms of 9th grade, the demographic groups most similar to Guamanians/Chamorros are Hopi (94.8%, a difference of 0.010%), Immigrants from Albania (94.8%, a difference of 0.010%), Immigrants from Argentina (94.8%, a difference of 0.010%), Argentinean (94.8%, a difference of 0.020%), and Liberian (94.8%, a difference of 0.020%).
| Demographics | Rating | Rank | 9th Grade |
| Immigrants | Uganda | 43.1 /100 | #180 | Average 94.8% |
| Sierra Leoneans | 42.7 /100 | #181 | Average 94.8% |
| Seminole | 42.5 /100 | #182 | Average 94.8% |
| Immigrants | Nepal | 39.7 /100 | #183 | Fair 94.8% |
| Argentineans | 37.6 /100 | #184 | Fair 94.8% |
| Liberians | 37.4 /100 | #185 | Fair 94.8% |
| Hopi | 37.1 /100 | #186 | Fair 94.8% |
| Guamanians/Chamorros | 35.5 /100 | #187 | Fair 94.8% |
| Immigrants | Albania | 34.5 /100 | #188 | Fair 94.8% |
| Immigrants | Argentina | 34.4 /100 | #189 | Fair 94.8% |
| Sudanese | 32.7 /100 | #190 | Fair 94.7% |
| Assyrians/Chaldeans/Syriacs | 32.0 /100 | #191 | Fair 94.7% |
| Immigrants | Northern Africa | 30.7 /100 | #192 | Fair 94.7% |
| Paraguayans | 30.1 /100 | #193 | Fair 94.7% |
| Panamanians | 29.0 /100 | #194 | Fair 94.7% |
Demographics Similar to U.S. Virgin Islanders by 9th Grade
In terms of 9th grade, the demographic groups most similar to U.S. Virgin Islanders are Colombian (94.0%, a difference of 0.030%), Immigrants from Senegal (94.1%, a difference of 0.050%), Immigrants from Nigeria (94.0%, a difference of 0.050%), Jamaican (94.1%, a difference of 0.060%), and Immigrants from Afghanistan (94.0%, a difference of 0.060%).
| Demographics | Rating | Rank | 9th Grade |
| Afghans | 1.8 /100 | #247 | Tragic 94.2% |
| Immigrants | Somalia | 1.4 /100 | #248 | Tragic 94.1% |
| Uruguayans | 1.3 /100 | #249 | Tragic 94.1% |
| Immigrants | Hong Kong | 1.3 /100 | #250 | Tragic 94.1% |
| Jamaicans | 1.0 /100 | #251 | Tragic 94.1% |
| Immigrants | Senegal | 0.9 /100 | #252 | Tragic 94.1% |
| Colombians | 0.8 /100 | #253 | Tragic 94.0% |
| U.S. Virgin Islanders | 0.7 /100 | #254 | Tragic 94.0% |
| Immigrants | Nigeria | 0.6 /100 | #255 | Tragic 94.0% |
| Immigrants | Afghanistan | 0.5 /100 | #256 | Tragic 94.0% |
| Immigrants | Costa Rica | 0.5 /100 | #257 | Tragic 94.0% |
| Immigrants | Thailand | 0.5 /100 | #258 | Tragic 93.9% |
| Ghanaians | 0.5 /100 | #259 | Tragic 93.9% |
| Pima | 0.4 /100 | #260 | Tragic 93.9% |
| South Americans | 0.4 /100 | #261 | Tragic 93.9% |