Immigrants vs Maltese 9th Grade
COMPARE
Immigrants
Maltese
9th Grade
9th Grade Comparison
Immigrants
Maltese
92.5%
9TH GRADE
0.0/ 100
METRIC RATING
307th/ 347
METRIC RANK
96.3%
9TH GRADE
100.0/ 100
METRIC RATING
30th/ 347
METRIC RANK
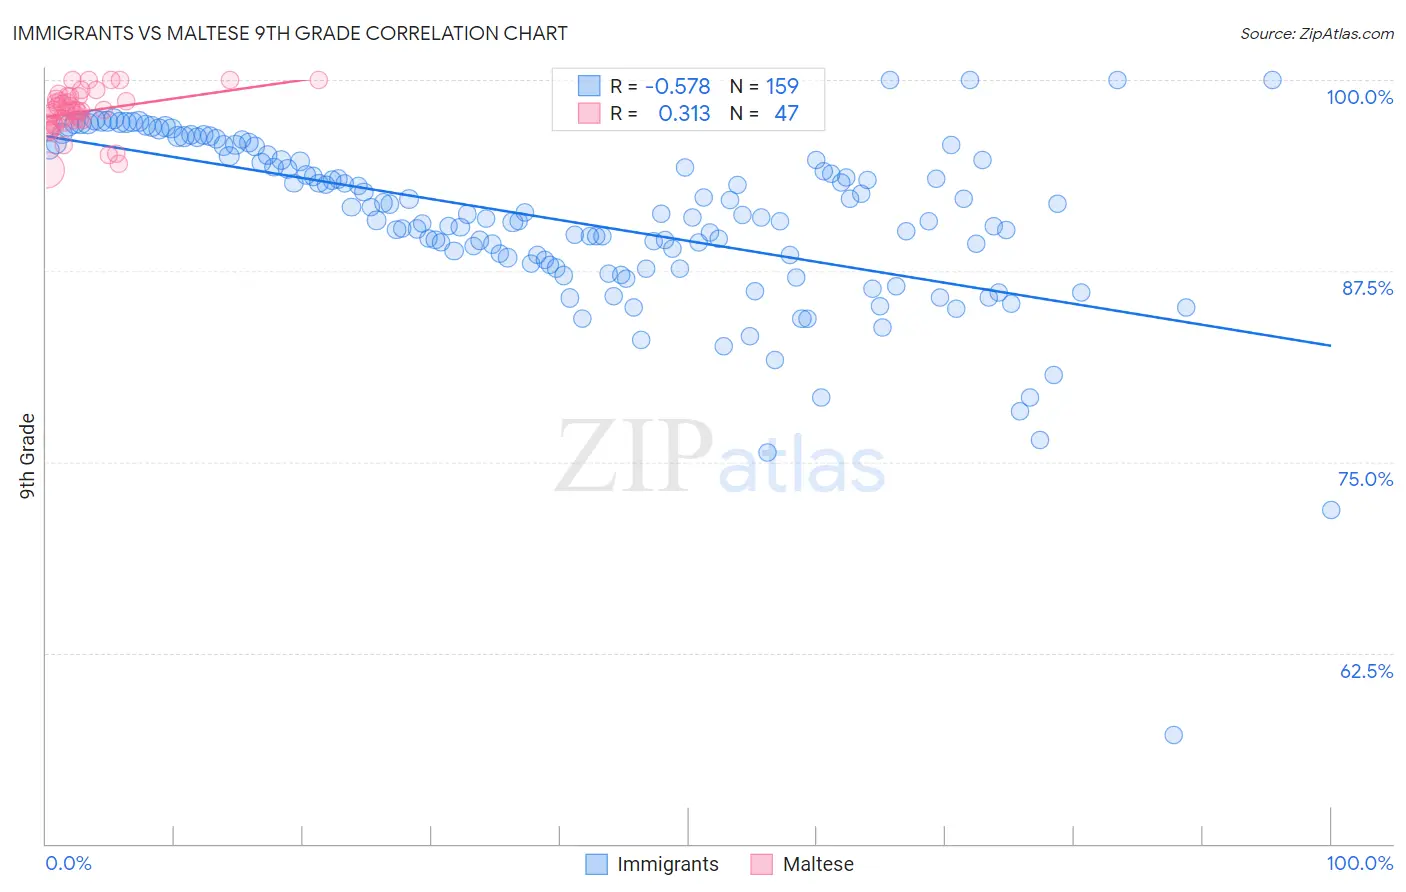
Immigrants vs Maltese 9th Grade Correlation Chart
The statistical analysis conducted on geographies consisting of 577,786,659 people shows a substantial negative correlation between the proportion of Immigrants and percentage of population with at least 9th grade education in the United States with a correlation coefficient (R) of -0.578 and weighted average of 92.5%. Similarly, the statistical analysis conducted on geographies consisting of 126,476,608 people shows a mild positive correlation between the proportion of Maltese and percentage of population with at least 9th grade education in the United States with a correlation coefficient (R) of 0.313 and weighted average of 96.3%, a difference of 4.1%.
9th Grade Correlation Summary
| Measurement | Immigrants | Maltese |
| Minimum | 57.2% | 94.1% |
| Maximum | 100.0% | 100.0% |
| Range | 42.8% | 5.9% |
| Mean | 90.8% | 97.9% |
| Median | 91.0% | 98.0% |
| Interquartile 25% (IQ1) | 88.0% | 97.2% |
| Interquartile 75% (IQ3) | 94.8% | 99.0% |
| Interquartile Range (IQR) | 6.8% | 1.7% |
| Standard Deviation (Sample) | 5.7% | 1.4% |
| Standard Deviation (Population) | 5.7% | 1.4% |
Similar Demographics by 9th Grade
Demographics Similar to Immigrants by 9th Grade
In terms of 9th grade, the demographic groups most similar to Immigrants are Immigrants from Guyana (92.5%, a difference of 0.010%), Japanese (92.6%, a difference of 0.10%), Immigrants from Vietnam (92.6%, a difference of 0.10%), Tohono O'odham (92.6%, a difference of 0.12%), and Guyanese (92.7%, a difference of 0.14%).
| Demographics | Rating | Rank | 9th Grade |
| Yaqui | 0.0 /100 | #300 | Tragic 92.9% |
| Immigrants | Haiti | 0.0 /100 | #301 | Tragic 92.7% |
| Immigrants | Dominica | 0.0 /100 | #302 | Tragic 92.7% |
| Guyanese | 0.0 /100 | #303 | Tragic 92.7% |
| Tohono O'odham | 0.0 /100 | #304 | Tragic 92.6% |
| Japanese | 0.0 /100 | #305 | Tragic 92.6% |
| Immigrants | Vietnam | 0.0 /100 | #306 | Tragic 92.6% |
| Immigrants | Immigrants | 0.0 /100 | #307 | Tragic 92.5% |
| Immigrants | Guyana | 0.0 /100 | #308 | Tragic 92.5% |
| Immigrants | Bangladesh | 0.0 /100 | #309 | Tragic 92.4% |
| Immigrants | Cambodia | 0.0 /100 | #310 | Tragic 92.4% |
| Immigrants | Fiji | 0.0 /100 | #311 | Tragic 92.3% |
| Houma | 0.0 /100 | #312 | Tragic 92.3% |
| Vietnamese | 0.0 /100 | #313 | Tragic 92.3% |
| Immigrants | Portugal | 0.0 /100 | #314 | Tragic 92.2% |
Demographics Similar to Maltese by 9th Grade
In terms of 9th grade, the demographic groups most similar to Maltese are British (96.3%, a difference of 0.0%), Belgian (96.3%, a difference of 0.010%), Chinese (96.3%, a difference of 0.020%), Luxembourger (96.3%, a difference of 0.020%), and Scotch-Irish (96.3%, a difference of 0.030%).
| Demographics | Rating | Rank | 9th Grade |
| Czechs | 100.0 /100 | #23 | Exceptional 96.4% |
| Latvians | 100.0 /100 | #24 | Exceptional 96.4% |
| French | 100.0 /100 | #25 | Exceptional 96.3% |
| French Canadians | 100.0 /100 | #26 | Exceptional 96.3% |
| Scotch-Irish | 100.0 /100 | #27 | Exceptional 96.3% |
| Eastern Europeans | 100.0 /100 | #28 | Exceptional 96.3% |
| Chinese | 100.0 /100 | #29 | Exceptional 96.3% |
| Maltese | 100.0 /100 | #30 | Exceptional 96.3% |
| British | 100.0 /100 | #31 | Exceptional 96.3% |
| Belgians | 100.0 /100 | #32 | Exceptional 96.3% |
| Luxembourgers | 100.0 /100 | #33 | Exceptional 96.3% |
| Hungarians | 100.0 /100 | #34 | Exceptional 96.2% |
| Bulgarians | 99.9 /100 | #35 | Exceptional 96.2% |
| Northern Europeans | 99.9 /100 | #36 | Exceptional 96.2% |
| Estonians | 99.9 /100 | #37 | Exceptional 96.1% |