Immigrants vs Immigrants from Barbados Associate's Degree
COMPARE
Immigrants
Immigrants from Barbados
Associate's Degree
Associate's Degree Comparison
Immigrants
Immigrants from Barbados
44.5%
ASSOCIATE'S DEGREE
10.5/ 100
METRIC RATING
217th/ 347
METRIC RANK
43.3%
ASSOCIATE'S DEGREE
2.9/ 100
METRIC RATING
230th/ 347
METRIC RANK
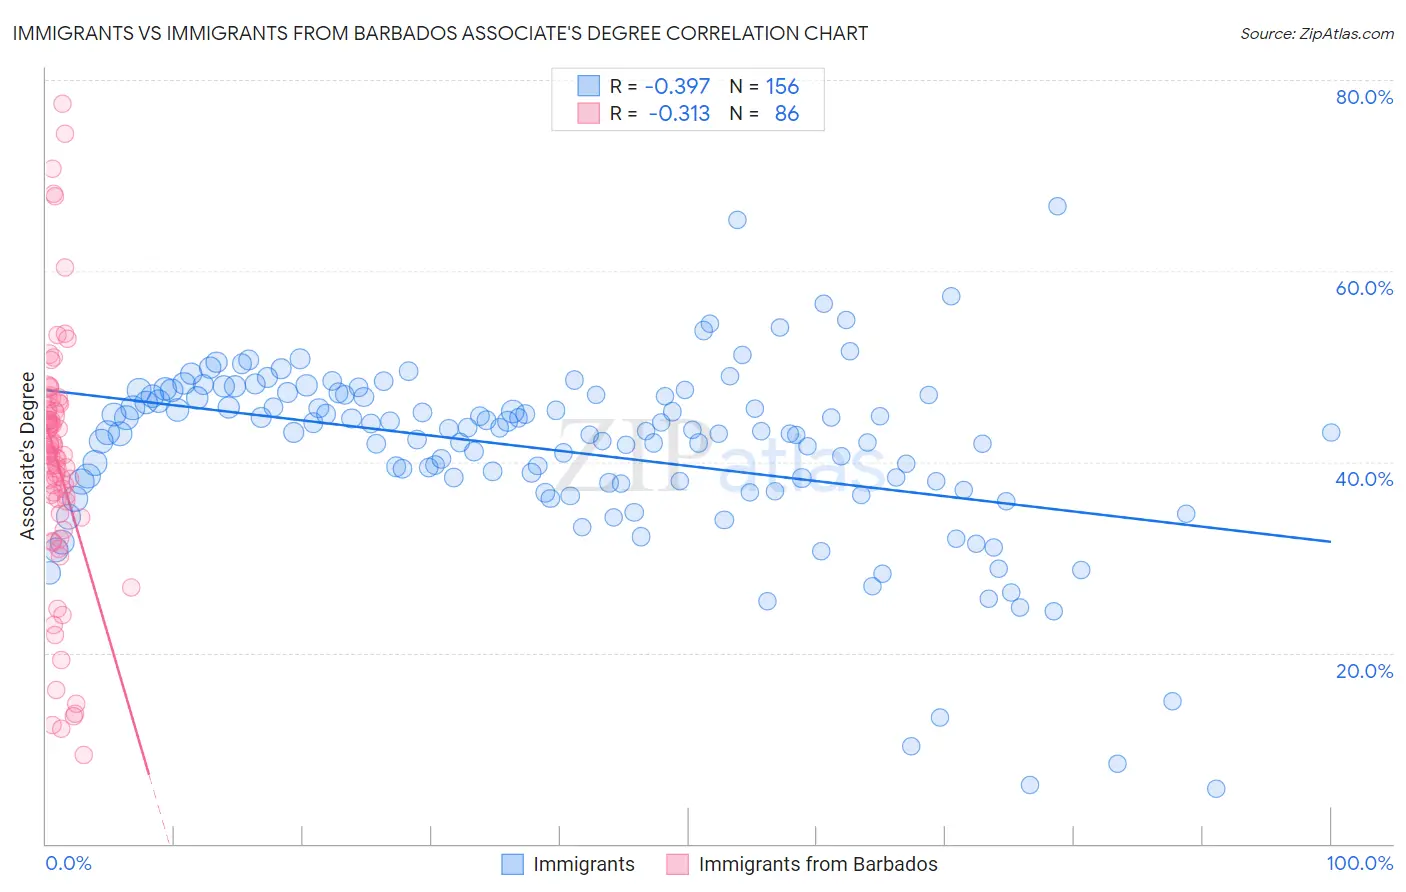
Immigrants vs Immigrants from Barbados Associate's Degree Correlation Chart
The statistical analysis conducted on geographies consisting of 577,638,441 people shows a mild negative correlation between the proportion of Immigrants and percentage of population with at least associate's degree education in the United States with a correlation coefficient (R) of -0.397 and weighted average of 44.5%. Similarly, the statistical analysis conducted on geographies consisting of 112,783,541 people shows a mild negative correlation between the proportion of Immigrants from Barbados and percentage of population with at least associate's degree education in the United States with a correlation coefficient (R) of -0.313 and weighted average of 43.3%, a difference of 2.8%.
Associate's Degree Correlation Summary
| Measurement | Immigrants | Immigrants from Barbados |
| Minimum | 5.7% | 9.3% |
| Maximum | 66.8% | 77.4% |
| Range | 61.1% | 68.2% |
| Mean | 41.2% | 40.0% |
| Median | 43.1% | 40.7% |
| Interquartile 25% (IQ1) | 37.8% | 35.9% |
| Interquartile 75% (IQ3) | 46.9% | 45.3% |
| Interquartile Range (IQR) | 9.1% | 9.5% |
| Standard Deviation (Sample) | 9.6% | 13.1% |
| Standard Deviation (Population) | 9.5% | 13.0% |
Demographics Similar to Immigrants and Immigrants from Barbados by Associate's Degree
In terms of associate's degree, the demographic groups most similar to Immigrants are Immigrants from Nigeria (44.6%, a difference of 0.19%), Spanish (44.4%, a difference of 0.25%), Immigrants from Panama (44.7%, a difference of 0.37%), Immigrants from Middle Africa (44.7%, a difference of 0.42%), and Immigrants from Ghana (44.8%, a difference of 0.68%). Similarly, the demographic groups most similar to Immigrants from Barbados are Liberian (43.3%, a difference of 0.010%), Immigrants from Trinidad and Tobago (43.3%, a difference of 0.070%), Hmong (43.4%, a difference of 0.23%), Native Hawaiian (43.1%, a difference of 0.43%), and Tongan (43.0%, a difference of 0.60%).
| Demographics | Rating | Rank | Associate's Degree |
| Immigrants | Ghana | 14.2 /100 | #213 | Poor 44.8% |
| Immigrants | Middle Africa | 12.7 /100 | #214 | Poor 44.7% |
| Immigrants | Panama | 12.4 /100 | #215 | Poor 44.7% |
| Immigrants | Nigeria | 11.4 /100 | #216 | Poor 44.6% |
| Immigrants | Immigrants | 10.5 /100 | #217 | Poor 44.5% |
| Spanish | 9.4 /100 | #218 | Tragic 44.4% |
| Whites/Caucasians | 7.5 /100 | #219 | Tragic 44.2% |
| Portuguese | 7.2 /100 | #220 | Tragic 44.1% |
| Immigrants | Western Africa | 6.6 /100 | #221 | Tragic 44.1% |
| Barbadians | 5.8 /100 | #222 | Tragic 43.9% |
| Sub-Saharan Africans | 5.5 /100 | #223 | Tragic 43.9% |
| West Indians | 5.2 /100 | #224 | Tragic 43.8% |
| Guamanians/Chamorros | 4.8 /100 | #225 | Tragic 43.8% |
| Immigrants | Burma/Myanmar | 4.3 /100 | #226 | Tragic 43.7% |
| Trinidadians and Tobagonians | 4.0 /100 | #227 | Tragic 43.6% |
| Hmong | 3.2 /100 | #228 | Tragic 43.4% |
| Immigrants | Trinidad and Tobago | 3.0 /100 | #229 | Tragic 43.3% |
| Immigrants | Barbados | 2.9 /100 | #230 | Tragic 43.3% |
| Liberians | 2.9 /100 | #231 | Tragic 43.3% |
| Native Hawaiians | 2.3 /100 | #232 | Tragic 43.1% |
| Tongans | 2.2 /100 | #233 | Tragic 43.0% |