Immigrants from Ukraine vs Soviet Union Associate's Degree
COMPARE
Immigrants from Ukraine
Soviet Union
Associate's Degree
Associate's Degree Comparison
Immigrants from Ukraine
Soviet Union
49.7%
ASSOCIATE'S DEGREE
98.0/ 100
METRIC RATING
97th/ 347
METRIC RANK
55.1%
ASSOCIATE'S DEGREE
100.0/ 100
METRIC RATING
16th/ 347
METRIC RANK
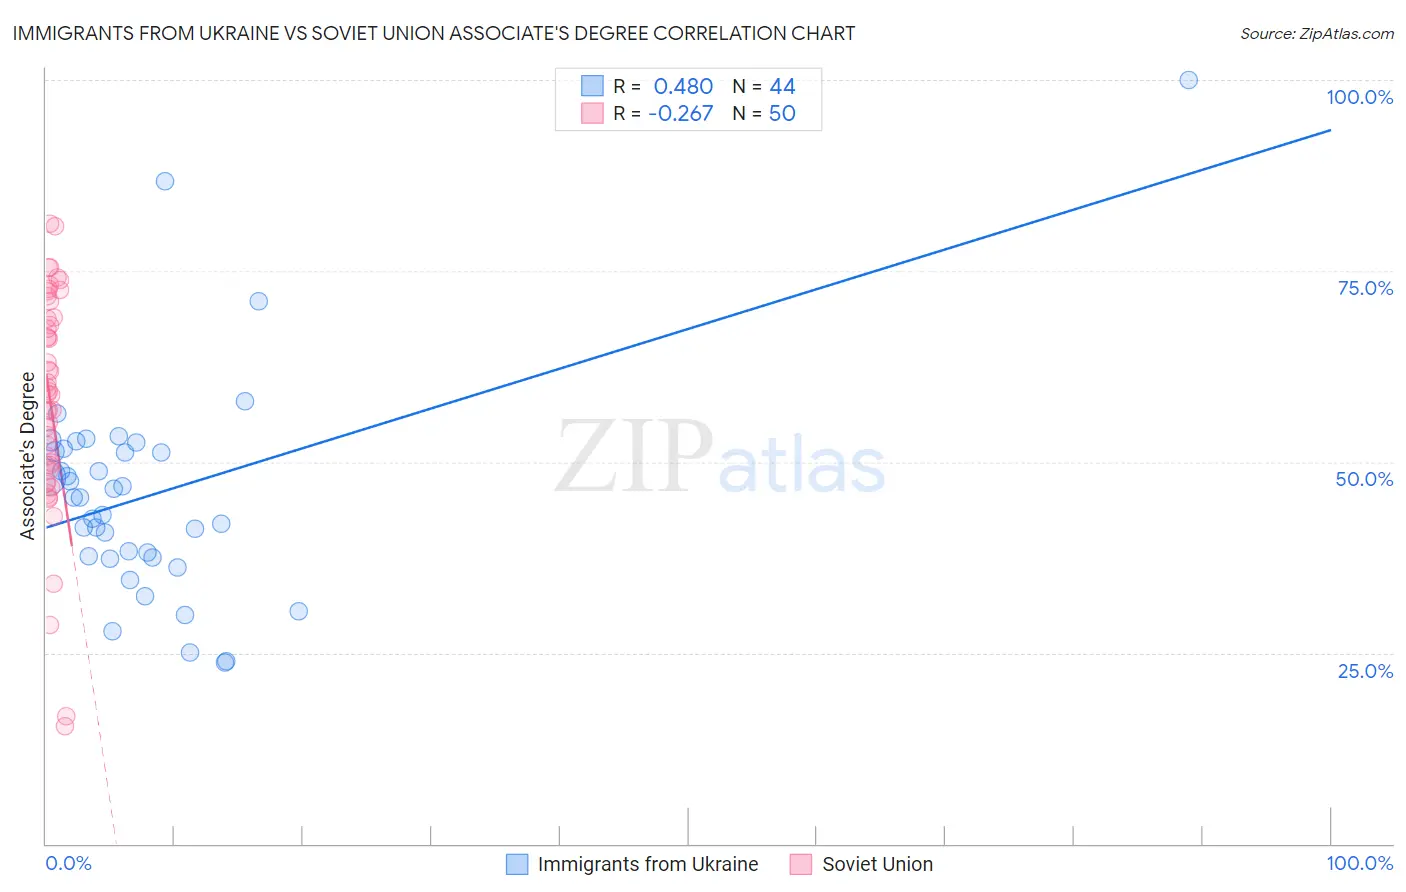
Immigrants from Ukraine vs Soviet Union Associate's Degree Correlation Chart
The statistical analysis conducted on geographies consisting of 289,711,904 people shows a moderate positive correlation between the proportion of Immigrants from Ukraine and percentage of population with at least associate's degree education in the United States with a correlation coefficient (R) of 0.480 and weighted average of 49.7%. Similarly, the statistical analysis conducted on geographies consisting of 43,514,626 people shows a weak negative correlation between the proportion of Soviet Union and percentage of population with at least associate's degree education in the United States with a correlation coefficient (R) of -0.267 and weighted average of 55.1%, a difference of 10.8%.
Associate's Degree Correlation Summary
| Measurement | Immigrants from Ukraine | Soviet Union |
| Minimum | 23.7% | 15.5% |
| Maximum | 100.0% | 81.2% |
| Range | 76.3% | 65.7% |
| Mean | 45.7% | 58.0% |
| Median | 45.3% | 59.1% |
| Interquartile 25% (IQ1) | 37.5% | 49.5% |
| Interquartile 75% (IQ3) | 51.5% | 68.9% |
| Interquartile Range (IQR) | 14.0% | 19.4% |
| Standard Deviation (Sample) | 14.5% | 14.7% |
| Standard Deviation (Population) | 14.3% | 14.5% |
Similar Demographics by Associate's Degree
Demographics Similar to Immigrants from Ukraine by Associate's Degree
In terms of associate's degree, the demographic groups most similar to Immigrants from Ukraine are Romanian (49.7%, a difference of 0.0%), Immigrants from England (49.7%, a difference of 0.020%), Immigrants from Northern Africa (49.7%, a difference of 0.090%), Macedonian (49.6%, a difference of 0.16%), and Immigrants from Nepal (49.5%, a difference of 0.38%).
| Demographics | Rating | Rank | Associate's Degree |
| Immigrants | Ethiopia | 98.7 /100 | #90 | Exceptional 50.1% |
| Immigrants | Western Asia | 98.7 /100 | #91 | Exceptional 50.1% |
| Immigrants | North America | 98.7 /100 | #92 | Exceptional 50.1% |
| Immigrants | Brazil | 98.5 /100 | #93 | Exceptional 50.0% |
| Laotians | 98.4 /100 | #94 | Exceptional 49.9% |
| Immigrants | England | 98.0 /100 | #95 | Exceptional 49.7% |
| Romanians | 98.0 /100 | #96 | Exceptional 49.7% |
| Immigrants | Ukraine | 98.0 /100 | #97 | Exceptional 49.7% |
| Immigrants | Northern Africa | 97.9 /100 | #98 | Exceptional 49.7% |
| Macedonians | 97.8 /100 | #99 | Exceptional 49.6% |
| Immigrants | Nepal | 97.5 /100 | #100 | Exceptional 49.5% |
| Northern Europeans | 97.3 /100 | #101 | Exceptional 49.5% |
| Chileans | 97.3 /100 | #102 | Exceptional 49.4% |
| Ukrainians | 97.1 /100 | #103 | Exceptional 49.4% |
| Venezuelans | 97.0 /100 | #104 | Exceptional 49.4% |
Demographics Similar to Soviet Union by Associate's Degree
In terms of associate's degree, the demographic groups most similar to Soviet Union are Eastern European (55.0%, a difference of 0.14%), Immigrants from Eastern Asia (55.4%, a difference of 0.47%), Immigrants from Hong Kong (55.4%, a difference of 0.50%), Indian (Asian) (54.8%, a difference of 0.61%), and Immigrants from China (55.5%, a difference of 0.65%).
| Demographics | Rating | Rank | Associate's Degree |
| Immigrants | Israel | 100.0 /100 | #9 | Exceptional 56.8% |
| Cypriots | 100.0 /100 | #10 | Exceptional 56.4% |
| Immigrants | Australia | 100.0 /100 | #11 | Exceptional 55.8% |
| Immigrants | South Central Asia | 100.0 /100 | #12 | Exceptional 55.7% |
| Immigrants | China | 100.0 /100 | #13 | Exceptional 55.5% |
| Immigrants | Hong Kong | 100.0 /100 | #14 | Exceptional 55.4% |
| Immigrants | Eastern Asia | 100.0 /100 | #15 | Exceptional 55.4% |
| Soviet Union | 100.0 /100 | #16 | Exceptional 55.1% |
| Eastern Europeans | 100.0 /100 | #17 | Exceptional 55.0% |
| Indians (Asian) | 100.0 /100 | #18 | Exceptional 54.8% |
| Immigrants | Ireland | 100.0 /100 | #19 | Exceptional 54.7% |
| Cambodians | 100.0 /100 | #20 | Exceptional 54.6% |
| Immigrants | Sweden | 100.0 /100 | #21 | Exceptional 54.6% |
| Immigrants | Japan | 100.0 /100 | #22 | Exceptional 54.6% |
| Burmese | 100.0 /100 | #23 | Exceptional 54.6% |