Immigrants from Italy vs Immigrants from Argentina No Schooling Completed
COMPARE
Immigrants from Italy
Immigrants from Argentina
No Schooling Completed
No Schooling Completed Comparison
Immigrants from Italy
Immigrants from Argentina
2.0%
NO SCHOOLING COMPLETED
68.9/ 100
METRIC RATING
153rd/ 347
METRIC RANK
2.1%
NO SCHOOLING COMPLETED
52.7/ 100
METRIC RATING
172nd/ 347
METRIC RANK
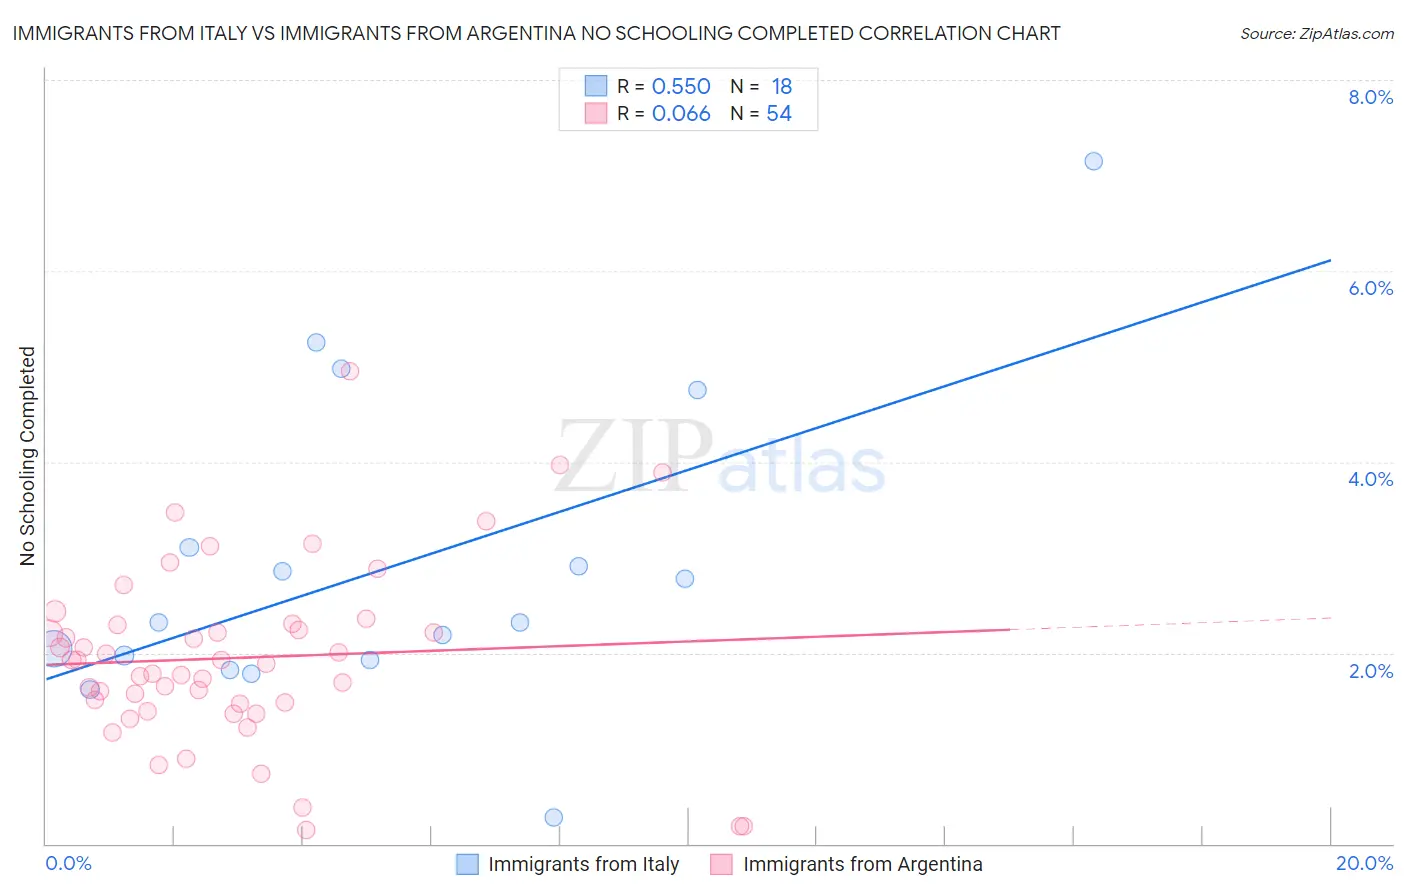
Immigrants from Italy vs Immigrants from Argentina No Schooling Completed Correlation Chart
The statistical analysis conducted on geographies consisting of 321,356,663 people shows a substantial positive correlation between the proportion of Immigrants from Italy and percentage of population with no schooling in the United States with a correlation coefficient (R) of 0.550 and weighted average of 2.0%. Similarly, the statistical analysis conducted on geographies consisting of 262,849,156 people shows a slight positive correlation between the proportion of Immigrants from Argentina and percentage of population with no schooling in the United States with a correlation coefficient (R) of 0.066 and weighted average of 2.1%, a difference of 2.4%.
No Schooling Completed Correlation Summary
| Measurement | Immigrants from Italy | Immigrants from Argentina |
| Minimum | 0.28% | 0.14% |
| Maximum | 7.1% | 4.9% |
| Range | 6.9% | 4.8% |
| Mean | 2.9% | 1.9% |
| Median | 2.3% | 1.9% |
| Interquartile 25% (IQ1) | 1.9% | 1.5% |
| Interquartile 75% (IQ3) | 3.1% | 2.3% |
| Interquartile Range (IQR) | 1.2% | 0.82% |
| Standard Deviation (Sample) | 1.6% | 0.94% |
| Standard Deviation (Population) | 1.6% | 0.94% |
Demographics Similar to Immigrants from Italy and Immigrants from Argentina by No Schooling Completed
In terms of no schooling completed, the demographic groups most similar to Immigrants from Italy are Immigrants from Venezuela (2.0%, a difference of 0.060%), Immigrants from Russia (2.0%, a difference of 0.20%), Immigrants from Eastern Europe (2.0%, a difference of 0.24%), Chilean (2.0%, a difference of 0.27%), and Immigrants from Sri Lanka (2.0%, a difference of 0.30%). Similarly, the demographic groups most similar to Immigrants from Argentina are Immigrants from Poland (2.1%, a difference of 0.33%), Argentinean (2.1%, a difference of 0.45%), Apache (2.1%, a difference of 0.53%), Cheyenne (2.1%, a difference of 0.81%), and Egyptian (2.1%, a difference of 0.89%).
| Demographics | Rating | Rank | No Schooling Completed |
| Immigrants | Eastern Europe | 70.4 /100 | #152 | Good 2.0% |
| Immigrants | Italy | 68.9 /100 | #153 | Good 2.0% |
| Immigrants | Venezuela | 68.5 /100 | #154 | Good 2.0% |
| Immigrants | Russia | 67.6 /100 | #155 | Good 2.0% |
| Chileans | 67.2 /100 | #156 | Good 2.0% |
| Immigrants | Sri Lanka | 67.0 /100 | #157 | Good 2.0% |
| Immigrants | Korea | 66.7 /100 | #158 | Good 2.0% |
| Immigrants | Spain | 66.4 /100 | #159 | Good 2.0% |
| Kenyans | 65.7 /100 | #160 | Good 2.0% |
| Ugandans | 64.6 /100 | #161 | Good 2.0% |
| Immigrants | Brazil | 63.8 /100 | #162 | Good 2.1% |
| Albanians | 62.2 /100 | #163 | Good 2.1% |
| Comanche | 60.7 /100 | #164 | Good 2.1% |
| Brazilians | 60.2 /100 | #165 | Good 2.1% |
| Dutch West Indians | 59.9 /100 | #166 | Average 2.1% |
| Egyptians | 59.2 /100 | #167 | Average 2.1% |
| Cheyenne | 58.6 /100 | #168 | Average 2.1% |
| Apache | 56.7 /100 | #169 | Average 2.1% |
| Argentineans | 56.0 /100 | #170 | Average 2.1% |
| Immigrants | Poland | 55.2 /100 | #171 | Average 2.1% |
| Immigrants | Argentina | 52.7 /100 | #172 | Average 2.1% |