Immigrants from Zimbabwe vs Iraqi Unemployment Among Youth under 25 years
COMPARE
Immigrants from Zimbabwe
Iraqi
Unemployment Among Youth under 25 years
Unemployment Among Youth under 25 years Comparison
Immigrants from Zimbabwe
Iraqis
10.8%
UNEMPLOYMENT AMONG YOUTH UNDER 25 YEARS
99.8/ 100
METRIC RATING
37th/ 347
METRIC RANK
11.5%
UNEMPLOYMENT AMONG YOUTH UNDER 25 YEARS
68.3/ 100
METRIC RATING
152nd/ 347
METRIC RANK
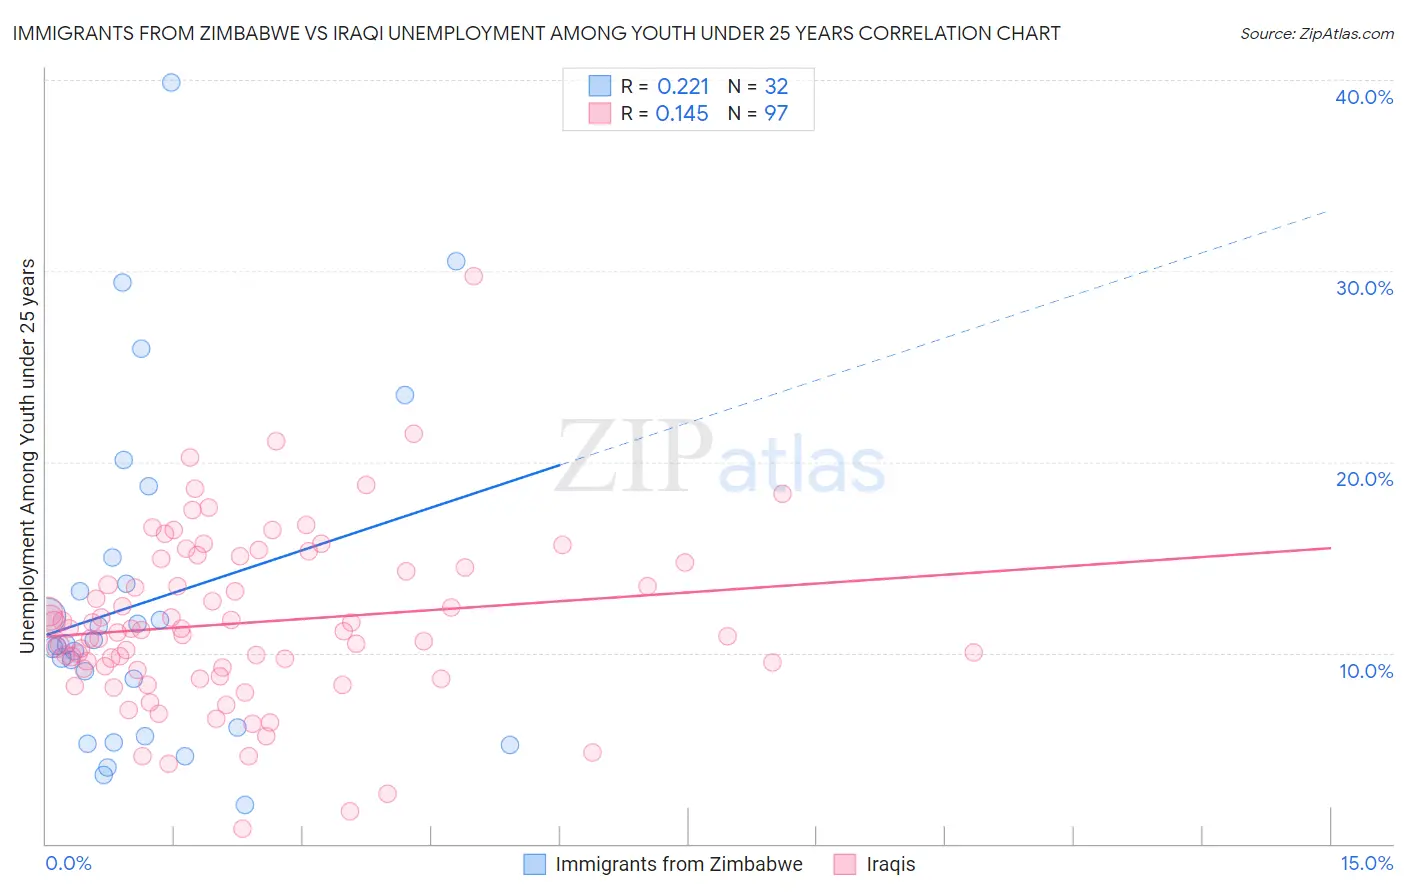
Immigrants from Zimbabwe vs Iraqi Unemployment Among Youth under 25 years Correlation Chart
The statistical analysis conducted on geographies consisting of 117,412,367 people shows a weak positive correlation between the proportion of Immigrants from Zimbabwe and unemployment rate among youth under the age of 25 in the United States with a correlation coefficient (R) of 0.221 and weighted average of 10.8%. Similarly, the statistical analysis conducted on geographies consisting of 170,162,065 people shows a poor positive correlation between the proportion of Iraqis and unemployment rate among youth under the age of 25 in the United States with a correlation coefficient (R) of 0.145 and weighted average of 11.5%, a difference of 6.1%.
Unemployment Among Youth under 25 years Correlation Summary
| Measurement | Immigrants from Zimbabwe | Iraqi |
| Minimum | 2.0% | 0.80% |
| Maximum | 39.9% | 29.7% |
| Range | 37.9% | 28.9% |
| Mean | 12.7% | 11.6% |
| Median | 10.4% | 11.1% |
| Interquartile 25% (IQ1) | 5.8% | 9.1% |
| Interquartile 75% (IQ3) | 14.3% | 14.6% |
| Interquartile Range (IQR) | 8.5% | 5.5% |
| Standard Deviation (Sample) | 8.8% | 4.5% |
| Standard Deviation (Population) | 8.7% | 4.5% |
Similar Demographics by Unemployment Among Youth under 25 years
Demographics Similar to Immigrants from Zimbabwe by Unemployment Among Youth under 25 years
In terms of unemployment among youth under 25 years, the demographic groups most similar to Immigrants from Zimbabwe are Immigrants from Congo (10.9%, a difference of 0.070%), Immigrants from Zaire (10.9%, a difference of 0.080%), Hmong (10.8%, a difference of 0.15%), Scottish (10.9%, a difference of 0.24%), and Immigrants from Nepal (10.8%, a difference of 0.29%).
| Demographics | Rating | Rank | Unemployment Among Youth under 25 years |
| Osage | 99.9 /100 | #30 | Exceptional 10.7% |
| Slovenes | 99.9 /100 | #31 | Exceptional 10.7% |
| Taiwanese | 99.9 /100 | #32 | Exceptional 10.8% |
| Europeans | 99.9 /100 | #33 | Exceptional 10.8% |
| English | 99.9 /100 | #34 | Exceptional 10.8% |
| Immigrants | Nepal | 99.9 /100 | #35 | Exceptional 10.8% |
| Hmong | 99.8 /100 | #36 | Exceptional 10.8% |
| Immigrants | Zimbabwe | 99.8 /100 | #37 | Exceptional 10.8% |
| Immigrants | Congo | 99.8 /100 | #38 | Exceptional 10.9% |
| Immigrants | Zaire | 99.8 /100 | #39 | Exceptional 10.9% |
| Scottish | 99.8 /100 | #40 | Exceptional 10.9% |
| Croatians | 99.8 /100 | #41 | Exceptional 10.9% |
| Cambodians | 99.7 /100 | #42 | Exceptional 10.9% |
| British | 99.7 /100 | #43 | Exceptional 10.9% |
| Welsh | 99.7 /100 | #44 | Exceptional 10.9% |
Demographics Similar to Iraqis by Unemployment Among Youth under 25 years
In terms of unemployment among youth under 25 years, the demographic groups most similar to Iraqis are Immigrants from Czechoslovakia (11.5%, a difference of 0.060%), Immigrants from Asia (11.5%, a difference of 0.070%), Immigrants from Romania (11.5%, a difference of 0.090%), Uruguayan (11.5%, a difference of 0.10%), and Immigrants from Germany (11.5%, a difference of 0.11%).
| Demographics | Rating | Rank | Unemployment Among Youth under 25 years |
| Argentineans | 73.0 /100 | #145 | Good 11.5% |
| Brazilians | 72.5 /100 | #146 | Good 11.5% |
| Laotians | 72.4 /100 | #147 | Good 11.5% |
| Immigrants | Northern Europe | 72.1 /100 | #148 | Good 11.5% |
| Immigrants | Cambodia | 71.8 /100 | #149 | Good 11.5% |
| Immigrants | Switzerland | 71.6 /100 | #150 | Good 11.5% |
| Uruguayans | 70.4 /100 | #151 | Good 11.5% |
| Iraqis | 68.3 /100 | #152 | Good 11.5% |
| Immigrants | Czechoslovakia | 67.1 /100 | #153 | Good 11.5% |
| Immigrants | Asia | 66.7 /100 | #154 | Good 11.5% |
| Immigrants | Romania | 66.3 /100 | #155 | Good 11.5% |
| Immigrants | Germany | 65.9 /100 | #156 | Good 11.5% |
| Indians (Asian) | 65.1 /100 | #157 | Good 11.5% |
| Immigrants | Turkey | 64.8 /100 | #158 | Good 11.5% |
| Immigrants | Western Europe | 64.7 /100 | #159 | Good 11.5% |