Immigrants from Indonesia vs Trinidadian and Tobagonian Associate's Degree
COMPARE
Immigrants from Indonesia
Trinidadian and Tobagonian
Associate's Degree
Associate's Degree Comparison
Immigrants from Indonesia
Trinidadians and Tobagonians
51.0%
ASSOCIATE'S DEGREE
99.5/ 100
METRIC RATING
68th/ 347
METRIC RANK
43.6%
ASSOCIATE'S DEGREE
4.0/ 100
METRIC RATING
227th/ 347
METRIC RANK
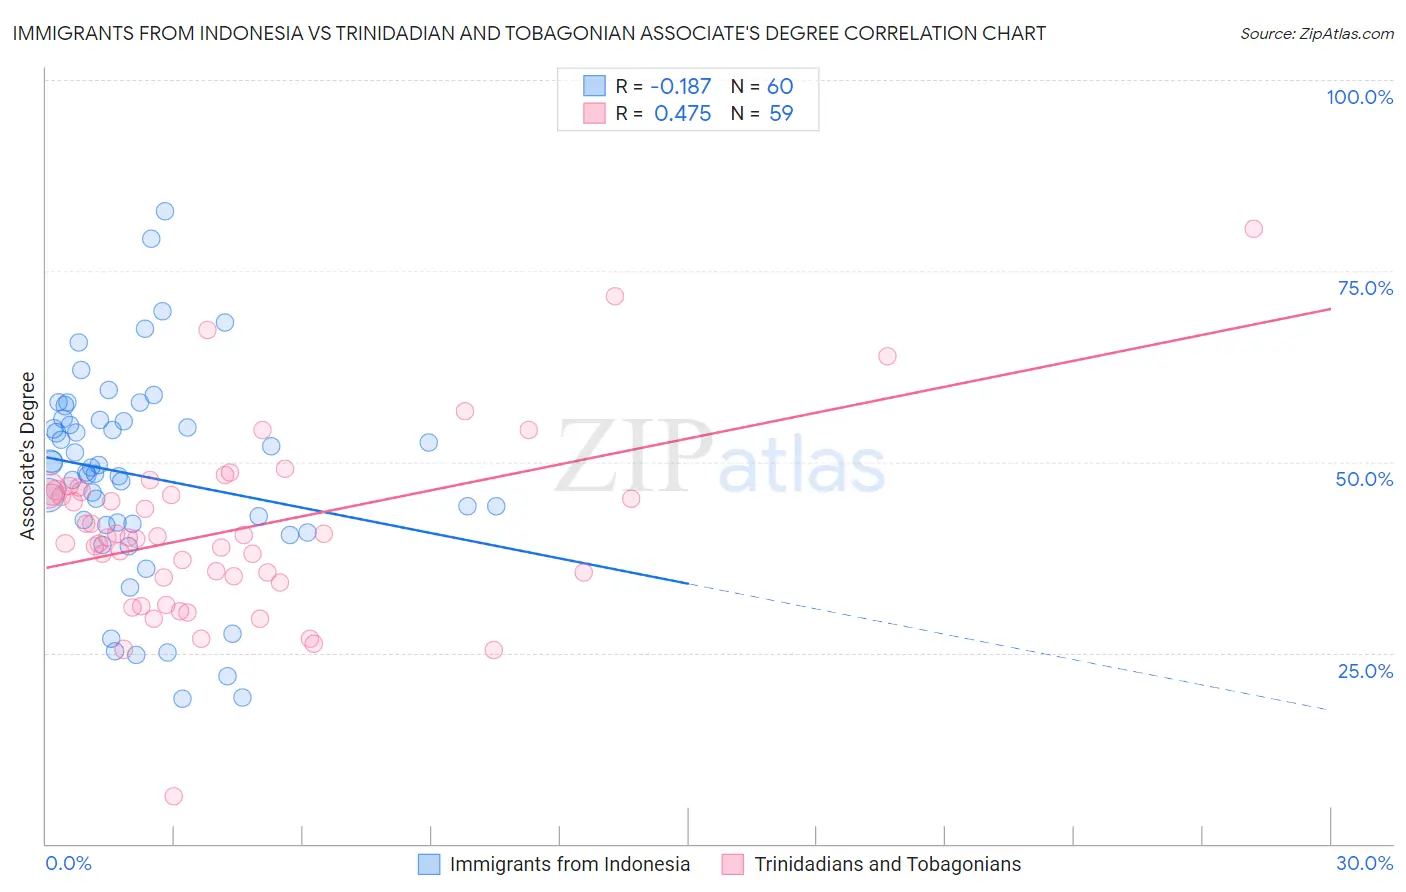
Immigrants from Indonesia vs Trinidadian and Tobagonian Associate's Degree Correlation Chart
The statistical analysis conducted on geographies consisting of 215,779,806 people shows a poor negative correlation between the proportion of Immigrants from Indonesia and percentage of population with at least associate's degree education in the United States with a correlation coefficient (R) of -0.187 and weighted average of 51.0%. Similarly, the statistical analysis conducted on geographies consisting of 219,861,537 people shows a moderate positive correlation between the proportion of Trinidadians and Tobagonians and percentage of population with at least associate's degree education in the United States with a correlation coefficient (R) of 0.475 and weighted average of 43.6%, a difference of 17.0%.
Associate's Degree Correlation Summary
| Measurement | Immigrants from Indonesia | Trinidadian and Tobagonian |
| Minimum | 19.0% | 6.2% |
| Maximum | 82.8% | 80.5% |
| Range | 63.7% | 74.4% |
| Mean | 48.1% | 41.1% |
| Median | 49.0% | 40.2% |
| Interquartile 25% (IQ1) | 41.9% | 34.9% |
| Interquartile 75% (IQ3) | 55.4% | 46.3% |
| Interquartile Range (IQR) | 13.5% | 11.4% |
| Standard Deviation (Sample) | 13.5% | 11.9% |
| Standard Deviation (Population) | 13.3% | 11.8% |
Similar Demographics by Associate's Degree
Demographics Similar to Immigrants from Indonesia by Associate's Degree
In terms of associate's degree, the demographic groups most similar to Immigrants from Indonesia are Egyptian (50.9%, a difference of 0.12%), Immigrants from Argentina (50.9%, a difference of 0.15%), Immigrants from Romania (50.9%, a difference of 0.16%), Immigrants from Pakistan (50.9%, a difference of 0.22%), and Argentinean (51.2%, a difference of 0.49%).
| Demographics | Rating | Rank | Associate's Degree |
| Immigrants | Kazakhstan | 99.7 /100 | #61 | Exceptional 51.4% |
| Bhutanese | 99.7 /100 | #62 | Exceptional 51.4% |
| South Africans | 99.7 /100 | #63 | Exceptional 51.4% |
| Immigrants | Netherlands | 99.7 /100 | #64 | Exceptional 51.4% |
| Zimbabweans | 99.7 /100 | #65 | Exceptional 51.3% |
| Immigrants | Europe | 99.7 /100 | #66 | Exceptional 51.3% |
| Argentineans | 99.6 /100 | #67 | Exceptional 51.2% |
| Immigrants | Indonesia | 99.5 /100 | #68 | Exceptional 51.0% |
| Egyptians | 99.5 /100 | #69 | Exceptional 50.9% |
| Immigrants | Argentina | 99.5 /100 | #70 | Exceptional 50.9% |
| Immigrants | Romania | 99.5 /100 | #71 | Exceptional 50.9% |
| Immigrants | Pakistan | 99.5 /100 | #72 | Exceptional 50.9% |
| Carpatho Rusyns | 99.3 /100 | #73 | Exceptional 50.6% |
| Lithuanians | 99.3 /100 | #74 | Exceptional 50.6% |
| Immigrants | Scotland | 99.3 /100 | #75 | Exceptional 50.6% |
Demographics Similar to Trinidadians and Tobagonians by Associate's Degree
In terms of associate's degree, the demographic groups most similar to Trinidadians and Tobagonians are Immigrants from Burma/Myanmar (43.7%, a difference of 0.17%), Guamanian/Chamorro (43.8%, a difference of 0.39%), Hmong (43.4%, a difference of 0.44%), West Indian (43.8%, a difference of 0.54%), and Immigrants from Trinidad and Tobago (43.3%, a difference of 0.60%).
| Demographics | Rating | Rank | Associate's Degree |
| Portuguese | 7.2 /100 | #220 | Tragic 44.1% |
| Immigrants | Western Africa | 6.6 /100 | #221 | Tragic 44.1% |
| Barbadians | 5.8 /100 | #222 | Tragic 43.9% |
| Sub-Saharan Africans | 5.5 /100 | #223 | Tragic 43.9% |
| West Indians | 5.2 /100 | #224 | Tragic 43.8% |
| Guamanians/Chamorros | 4.8 /100 | #225 | Tragic 43.8% |
| Immigrants | Burma/Myanmar | 4.3 /100 | #226 | Tragic 43.7% |
| Trinidadians and Tobagonians | 4.0 /100 | #227 | Tragic 43.6% |
| Hmong | 3.2 /100 | #228 | Tragic 43.4% |
| Immigrants | Trinidad and Tobago | 3.0 /100 | #229 | Tragic 43.3% |
| Immigrants | Barbados | 2.9 /100 | #230 | Tragic 43.3% |
| Liberians | 2.9 /100 | #231 | Tragic 43.3% |
| Native Hawaiians | 2.3 /100 | #232 | Tragic 43.1% |
| Tongans | 2.2 /100 | #233 | Tragic 43.0% |
| Tlingit-Haida | 2.1 /100 | #234 | Tragic 43.0% |