Immigrants from Zaire vs Trinidadian and Tobagonian Disability Age 18 to 34
COMPARE
Immigrants from Zaire
Trinidadian and Tobagonian
Disability Age 18 to 34
Disability Age 18 to 34 Comparison
Immigrants from Zaire
Trinidadians and Tobagonians
7.1%
DISABILITY AGE 18 TO 34
0.9/ 100
METRIC RATING
244th/ 347
METRIC RANK
6.0%
DISABILITY AGE 18 TO 34
99.5/ 100
METRIC RATING
65th/ 347
METRIC RANK
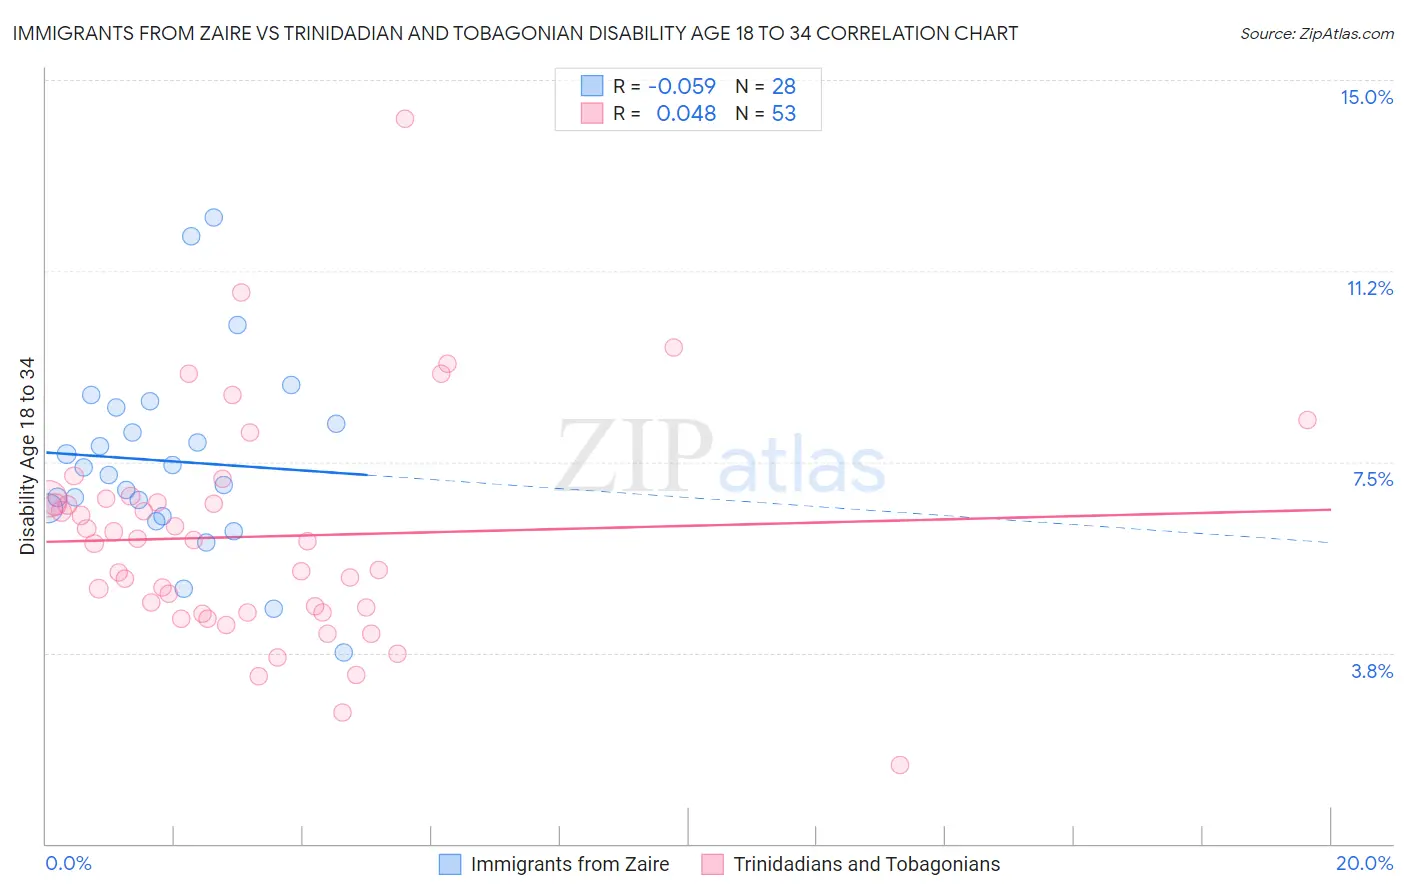
Immigrants from Zaire vs Trinidadian and Tobagonian Disability Age 18 to 34 Correlation Chart
The statistical analysis conducted on geographies consisting of 107,219,427 people shows a slight negative correlation between the proportion of Immigrants from Zaire and percentage of population with a disability between the ages 18 and 35 in the United States with a correlation coefficient (R) of -0.059 and weighted average of 7.1%. Similarly, the statistical analysis conducted on geographies consisting of 219,707,802 people shows no correlation between the proportion of Trinidadians and Tobagonians and percentage of population with a disability between the ages 18 and 35 in the United States with a correlation coefficient (R) of 0.048 and weighted average of 6.0%, a difference of 19.2%.
Disability Age 18 to 34 Correlation Summary
| Measurement | Immigrants from Zaire | Trinidadian and Tobagonian |
| Minimum | 3.7% | 1.5% |
| Maximum | 12.3% | 14.3% |
| Range | 8.6% | 12.7% |
| Mean | 7.5% | 6.0% |
| Median | 7.3% | 5.9% |
| Interquartile 25% (IQ1) | 6.5% | 4.5% |
| Interquartile 75% (IQ3) | 8.4% | 6.8% |
| Interquartile Range (IQR) | 1.9% | 2.2% |
| Standard Deviation (Sample) | 1.9% | 2.2% |
| Standard Deviation (Population) | 1.9% | 2.2% |
Similar Demographics by Disability Age 18 to 34
Demographics Similar to Immigrants from Zaire by Disability Age 18 to 34
In terms of disability age 18 to 34, the demographic groups most similar to Immigrants from Zaire are Hungarian (7.1%, a difference of 0.10%), Immigrants from Liberia (7.1%, a difference of 0.12%), Icelander (7.1%, a difference of 0.20%), Immigrants from Congo (7.1%, a difference of 0.27%), and Yugoslavian (7.2%, a difference of 0.27%).
| Demographics | Rating | Rank | Disability Age 18 to 34 |
| Austrians | 1.3 /100 | #237 | Tragic 7.1% |
| Marshallese | 1.3 /100 | #238 | Tragic 7.1% |
| Italians | 1.2 /100 | #239 | Tragic 7.1% |
| Arapaho | 1.1 /100 | #240 | Tragic 7.1% |
| Nepalese | 1.1 /100 | #241 | Tragic 7.1% |
| Immigrants | Congo | 1.1 /100 | #242 | Tragic 7.1% |
| Icelanders | 1.0 /100 | #243 | Tragic 7.1% |
| Immigrants | Zaire | 0.9 /100 | #244 | Tragic 7.1% |
| Hungarians | 0.9 /100 | #245 | Tragic 7.1% |
| Immigrants | Liberia | 0.8 /100 | #246 | Tragic 7.1% |
| Yugoslavians | 0.8 /100 | #247 | Tragic 7.2% |
| Guamanians/Chamorros | 0.8 /100 | #248 | Tragic 7.2% |
| Malaysians | 0.7 /100 | #249 | Tragic 7.2% |
| Fijians | 0.6 /100 | #250 | Tragic 7.2% |
| Spaniards | 0.6 /100 | #251 | Tragic 7.2% |
Demographics Similar to Trinidadians and Tobagonians by Disability Age 18 to 34
In terms of disability age 18 to 34, the demographic groups most similar to Trinidadians and Tobagonians are Taiwanese (6.0%, a difference of 0.14%), Burmese (6.0%, a difference of 0.14%), Salvadoran (6.0%, a difference of 0.15%), Immigrants from North Macedonia (6.0%, a difference of 0.18%), and Peruvian (6.0%, a difference of 0.21%).
| Demographics | Rating | Rank | Disability Age 18 to 34 |
| Immigrants | Serbia | 99.7 /100 | #58 | Exceptional 5.9% |
| Immigrants | Caribbean | 99.6 /100 | #59 | Exceptional 6.0% |
| Immigrants | Sri Lanka | 99.6 /100 | #60 | Exceptional 6.0% |
| British West Indians | 99.6 /100 | #61 | Exceptional 6.0% |
| Peruvians | 99.6 /100 | #62 | Exceptional 6.0% |
| Salvadorans | 99.6 /100 | #63 | Exceptional 6.0% |
| Taiwanese | 99.6 /100 | #64 | Exceptional 6.0% |
| Trinidadians and Tobagonians | 99.5 /100 | #65 | Exceptional 6.0% |
| Burmese | 99.5 /100 | #66 | Exceptional 6.0% |
| Immigrants | North Macedonia | 99.5 /100 | #67 | Exceptional 6.0% |
| Immigrants | Poland | 99.5 /100 | #68 | Exceptional 6.0% |
| Immigrants | West Indies | 99.4 /100 | #69 | Exceptional 6.0% |
| Immigrants | Greece | 99.4 /100 | #70 | Exceptional 6.0% |
| Immigrants | Japan | 99.3 /100 | #71 | Exceptional 6.0% |
| Immigrants | Lebanon | 99.2 /100 | #72 | Exceptional 6.0% |