Immigrants from Zaire vs Trinidadian and Tobagonian In Labor Force | Age 45-54
COMPARE
Immigrants from Zaire
Trinidadian and Tobagonian
In Labor Force | Age 45-54
In Labor Force | Age 45-54 Comparison
Immigrants from Zaire
Trinidadians and Tobagonians
82.8%
IN LABOR FORCE | AGE 45-54
52.9/ 100
METRIC RATING
171st/ 347
METRIC RANK
81.9%
IN LABOR FORCE | AGE 45-54
1.1/ 100
METRIC RATING
238th/ 347
METRIC RANK
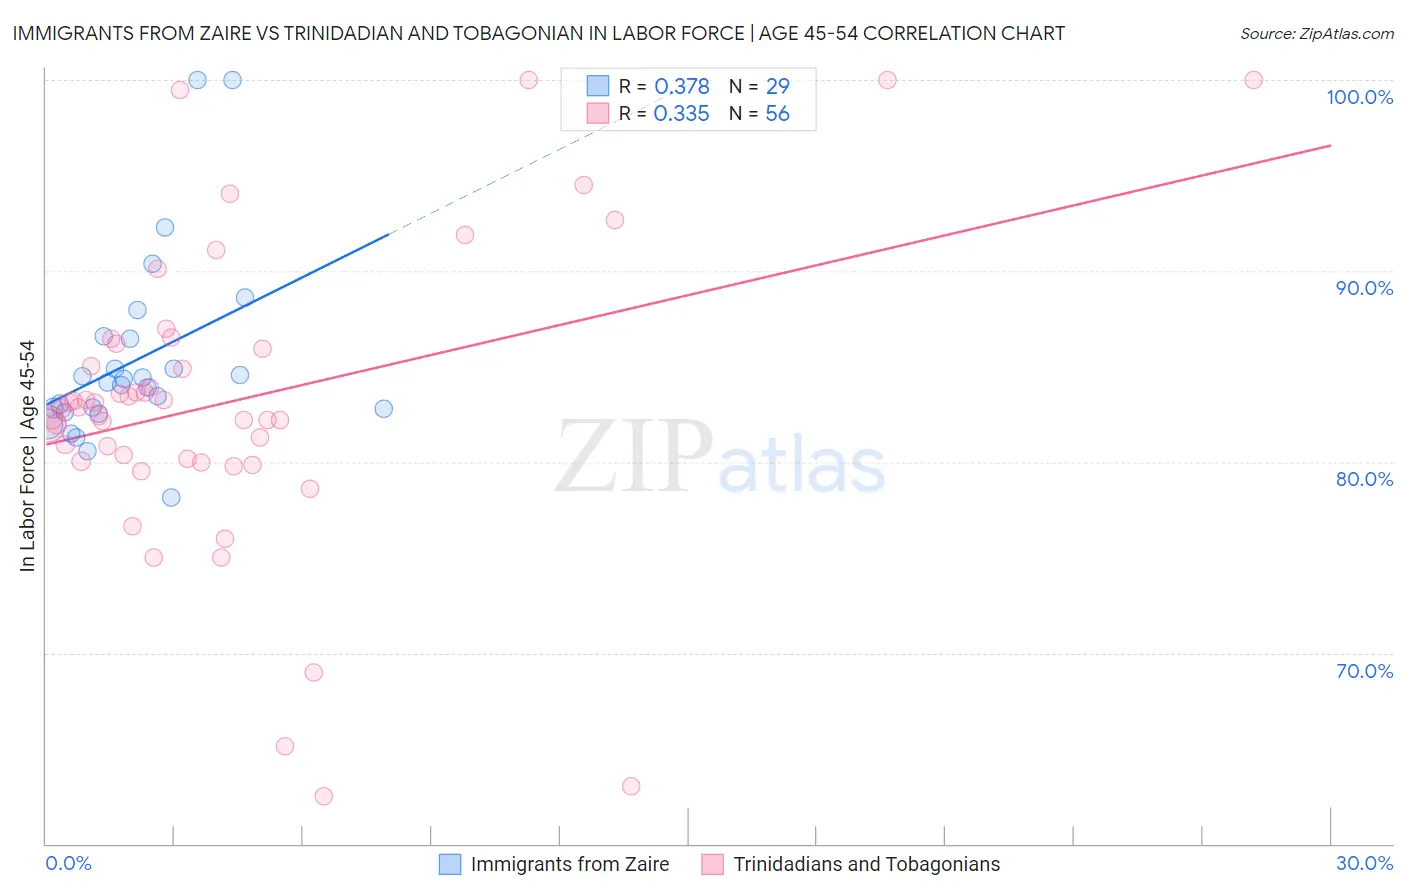
Immigrants from Zaire vs Trinidadian and Tobagonian In Labor Force | Age 45-54 Correlation Chart
The statistical analysis conducted on geographies consisting of 107,243,471 people shows a mild positive correlation between the proportion of Immigrants from Zaire and labor force participation rate among population between the ages 45 and 54 in the United States with a correlation coefficient (R) of 0.378 and weighted average of 82.8%. Similarly, the statistical analysis conducted on geographies consisting of 219,704,742 people shows a mild positive correlation between the proportion of Trinidadians and Tobagonians and labor force participation rate among population between the ages 45 and 54 in the United States with a correlation coefficient (R) of 0.335 and weighted average of 81.9%, a difference of 1.0%.
In Labor Force | Age 45-54 Correlation Summary
| Measurement | Immigrants from Zaire | Trinidadian and Tobagonian |
| Minimum | 78.2% | 62.5% |
| Maximum | 100.0% | 100.0% |
| Range | 21.8% | 37.5% |
| Mean | 85.4% | 83.2% |
| Median | 84.1% | 82.8% |
| Interquartile 25% (IQ1) | 82.7% | 80.1% |
| Interquartile 75% (IQ3) | 86.5% | 86.1% |
| Interquartile Range (IQR) | 3.8% | 6.0% |
| Standard Deviation (Sample) | 5.0% | 7.9% |
| Standard Deviation (Population) | 4.9% | 7.8% |
Similar Demographics by In Labor Force | Age 45-54
Demographics Similar to Immigrants from Zaire by In Labor Force | Age 45-54
In terms of in labor force | age 45-54, the demographic groups most similar to Immigrants from Zaire are Pakistani (82.8%, a difference of 0.0%), Immigrants from Western Africa (82.8%, a difference of 0.010%), Icelander (82.8%, a difference of 0.010%), Nicaraguan (82.8%, a difference of 0.020%), and Swiss (82.8%, a difference of 0.030%).
| Demographics | Rating | Rank | In Labor Force | Age 45-54 |
| German Russians | 61.3 /100 | #164 | Good 82.8% |
| Immigrants | Sudan | 59.9 /100 | #165 | Average 82.8% |
| Immigrants | South Eastern Asia | 57.4 /100 | #166 | Average 82.8% |
| Swiss | 56.5 /100 | #167 | Average 82.8% |
| Immigrants | South Africa | 55.8 /100 | #168 | Average 82.8% |
| Immigrants | Western Africa | 54.1 /100 | #169 | Average 82.8% |
| Pakistanis | 53.2 /100 | #170 | Average 82.8% |
| Immigrants | Zaire | 52.9 /100 | #171 | Average 82.8% |
| Icelanders | 51.8 /100 | #172 | Average 82.8% |
| Nicaraguans | 50.3 /100 | #173 | Average 82.8% |
| Costa Ricans | 50.0 /100 | #174 | Average 82.8% |
| Immigrants | Liberia | 47.9 /100 | #175 | Average 82.7% |
| Northern Europeans | 46.9 /100 | #176 | Average 82.7% |
| Immigrants | Nicaragua | 44.6 /100 | #177 | Average 82.7% |
| Nigerians | 40.5 /100 | #178 | Average 82.7% |
Demographics Similar to Trinidadians and Tobagonians by In Labor Force | Age 45-54
In terms of in labor force | age 45-54, the demographic groups most similar to Trinidadians and Tobagonians are Basque (82.0%, a difference of 0.010%), Immigrants from Trinidad and Tobago (82.0%, a difference of 0.010%), Subsaharan African (82.0%, a difference of 0.020%), Immigrants from Thailand (81.9%, a difference of 0.030%), and Immigrants from El Salvador (81.9%, a difference of 0.030%).
| Demographics | Rating | Rank | In Labor Force | Age 45-54 |
| Immigrants | Senegal | 1.7 /100 | #231 | Tragic 82.0% |
| Immigrants | Portugal | 1.7 /100 | #232 | Tragic 82.0% |
| Malaysians | 1.7 /100 | #233 | Tragic 82.0% |
| Salvadorans | 1.7 /100 | #234 | Tragic 82.0% |
| Sub-Saharan Africans | 1.2 /100 | #235 | Tragic 82.0% |
| Basques | 1.2 /100 | #236 | Tragic 82.0% |
| Immigrants | Trinidad and Tobago | 1.2 /100 | #237 | Tragic 82.0% |
| Trinidadians and Tobagonians | 1.1 /100 | #238 | Tragic 81.9% |
| Immigrants | Thailand | 1.0 /100 | #239 | Tragic 81.9% |
| Immigrants | El Salvador | 1.0 /100 | #240 | Tragic 81.9% |
| Immigrants | Cambodia | 0.8 /100 | #241 | Tragic 81.9% |
| Whites/Caucasians | 0.7 /100 | #242 | Tragic 81.9% |
| Samoans | 0.6 /100 | #243 | Tragic 81.8% |
| Celtics | 0.4 /100 | #244 | Tragic 81.8% |
| Alaska Natives | 0.4 /100 | #245 | Tragic 81.8% |