Immigrants from Zaire vs Immigrants from Cuba 10th Grade
COMPARE
Immigrants from Zaire
Immigrants from Cuba
10th Grade
10th Grade Comparison
Immigrants from Zaire
Immigrants from Cuba
93.4%
10TH GRADE
16.7/ 100
METRIC RATING
212th/ 347
METRIC RANK
90.2%
10TH GRADE
0.0/ 100
METRIC RATING
318th/ 347
METRIC RANK
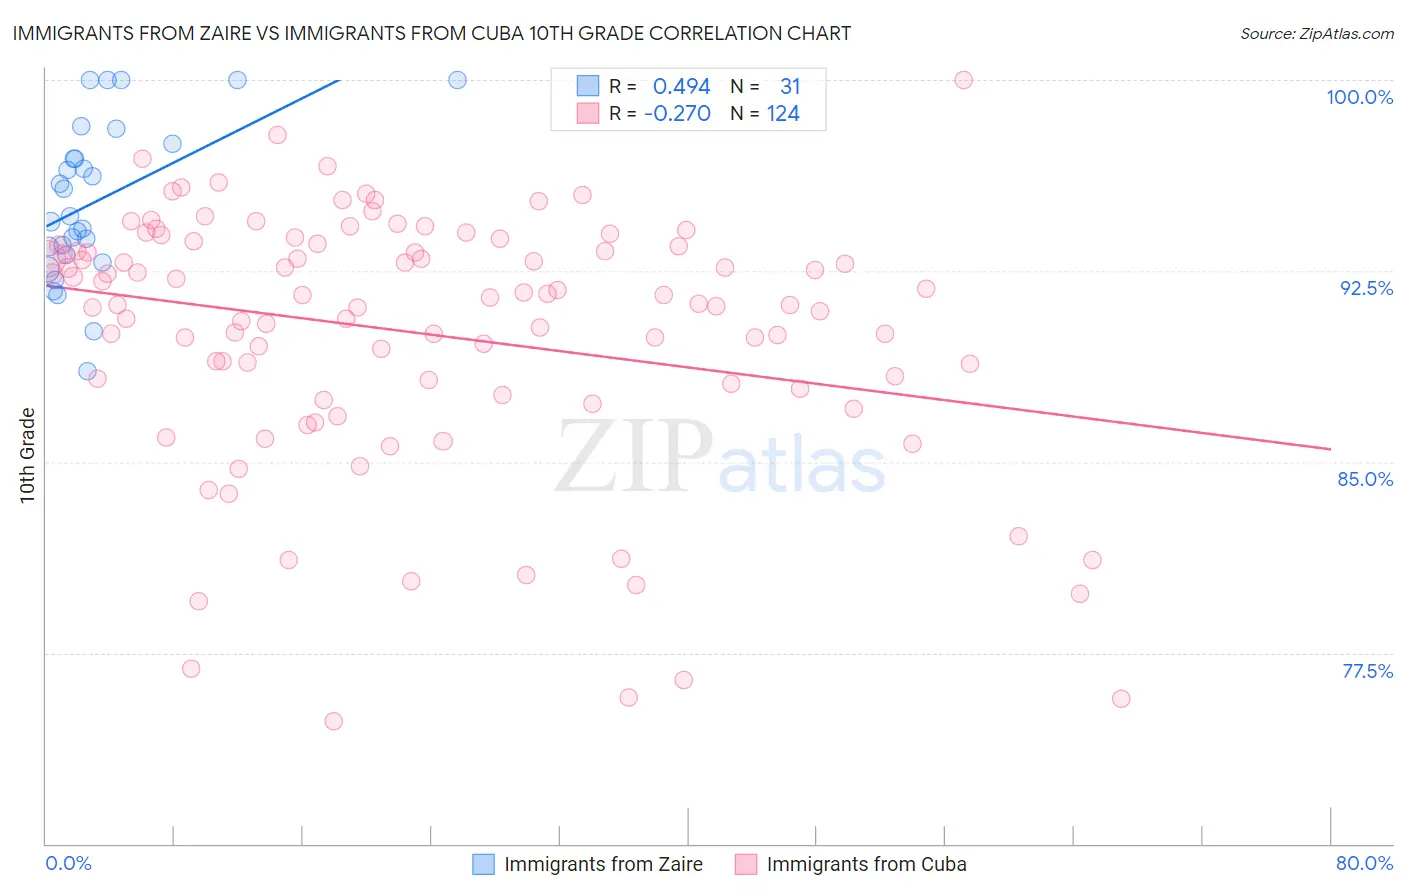
Immigrants from Zaire vs Immigrants from Cuba 10th Grade Correlation Chart
The statistical analysis conducted on geographies consisting of 107,212,695 people shows a moderate positive correlation between the proportion of Immigrants from Zaire and percentage of population with at least 10th grade education in the United States with a correlation coefficient (R) of 0.494 and weighted average of 93.4%. Similarly, the statistical analysis conducted on geographies consisting of 326,019,170 people shows a weak negative correlation between the proportion of Immigrants from Cuba and percentage of population with at least 10th grade education in the United States with a correlation coefficient (R) of -0.270 and weighted average of 90.2%, a difference of 3.5%.
10th Grade Correlation Summary
| Measurement | Immigrants from Zaire | Immigrants from Cuba |
| Minimum | 88.6% | 74.8% |
| Maximum | 100.0% | 100.0% |
| Range | 11.4% | 25.2% |
| Mean | 95.3% | 90.1% |
| Median | 94.6% | 91.3% |
| Interquartile 25% (IQ1) | 93.1% | 88.0% |
| Interquartile 75% (IQ3) | 97.5% | 93.5% |
| Interquartile Range (IQR) | 4.4% | 5.5% |
| Standard Deviation (Sample) | 3.1% | 5.0% |
| Standard Deviation (Population) | 3.0% | 5.0% |
Similar Demographics by 10th Grade
Demographics Similar to Immigrants from Zaire by 10th Grade
In terms of 10th grade, the demographic groups most similar to Immigrants from Zaire are Cajun (93.4%, a difference of 0.0%), Indian (Asian) (93.4%, a difference of 0.010%), Immigrants from Asia (93.4%, a difference of 0.020%), Immigrants from Bahamas (93.4%, a difference of 0.020%), and Immigrants from Chile (93.4%, a difference of 0.030%).
| Demographics | Rating | Rank | 10th Grade |
| Immigrants | Indonesia | 20.2 /100 | #205 | Fair 93.4% |
| Immigrants | Sudan | 20.0 /100 | #206 | Fair 93.4% |
| Samoans | 19.5 /100 | #207 | Poor 93.4% |
| Immigrants | Syria | 19.4 /100 | #208 | Poor 93.4% |
| Immigrants | Chile | 18.8 /100 | #209 | Poor 93.4% |
| Indians (Asian) | 17.6 /100 | #210 | Poor 93.4% |
| Cajuns | 16.9 /100 | #211 | Poor 93.4% |
| Immigrants | Zaire | 16.7 /100 | #212 | Poor 93.4% |
| Immigrants | Asia | 15.7 /100 | #213 | Poor 93.4% |
| Immigrants | Bahamas | 15.2 /100 | #214 | Poor 93.4% |
| Immigrants | Oceania | 15.1 /100 | #215 | Poor 93.4% |
| Immigrants | Eastern Africa | 14.7 /100 | #216 | Poor 93.4% |
| Portuguese | 12.1 /100 | #217 | Poor 93.3% |
| Immigrants | Liberia | 10.2 /100 | #218 | Poor 93.3% |
| Seminole | 10.2 /100 | #219 | Poor 93.3% |
Demographics Similar to Immigrants from Cuba by 10th Grade
In terms of 10th grade, the demographic groups most similar to Immigrants from Cuba are Nicaraguan (90.2%, a difference of 0.080%), Houma (90.2%, a difference of 0.090%), Belizean (90.2%, a difference of 0.090%), Tohono O'odham (90.1%, a difference of 0.10%), and Immigrants from Belize (90.1%, a difference of 0.19%).
| Demographics | Rating | Rank | 10th Grade |
| Immigrants | Cambodia | 0.0 /100 | #311 | Tragic 90.9% |
| Immigrants | Portugal | 0.0 /100 | #312 | Tragic 90.8% |
| Cape Verdeans | 0.0 /100 | #313 | Tragic 90.8% |
| Nepalese | 0.0 /100 | #314 | Tragic 90.7% |
| Immigrants | Caribbean | 0.0 /100 | #315 | Tragic 90.6% |
| Ecuadorians | 0.0 /100 | #316 | Tragic 90.6% |
| Immigrants | Ecuador | 0.0 /100 | #317 | Tragic 90.4% |
| Immigrants | Cuba | 0.0 /100 | #318 | Tragic 90.2% |
| Nicaraguans | 0.0 /100 | #319 | Tragic 90.2% |
| Houma | 0.0 /100 | #320 | Tragic 90.2% |
| Belizeans | 0.0 /100 | #321 | Tragic 90.2% |
| Tohono O'odham | 0.0 /100 | #322 | Tragic 90.1% |
| Immigrants | Belize | 0.0 /100 | #323 | Tragic 90.1% |
| Immigrants | Armenia | 0.0 /100 | #324 | Tragic 89.9% |
| Puerto Ricans | 0.0 /100 | #325 | Tragic 89.8% |