Immigrants from Zaire vs White/Caucasian 10th Grade
COMPARE
Immigrants from Zaire
White/Caucasian
10th Grade
10th Grade Comparison
Immigrants from Zaire
Whites/Caucasians
93.4%
10TH GRADE
16.7/ 100
METRIC RATING
212th/ 347
METRIC RANK
94.7%
10TH GRADE
98.8/ 100
METRIC RATING
91st/ 347
METRIC RANK
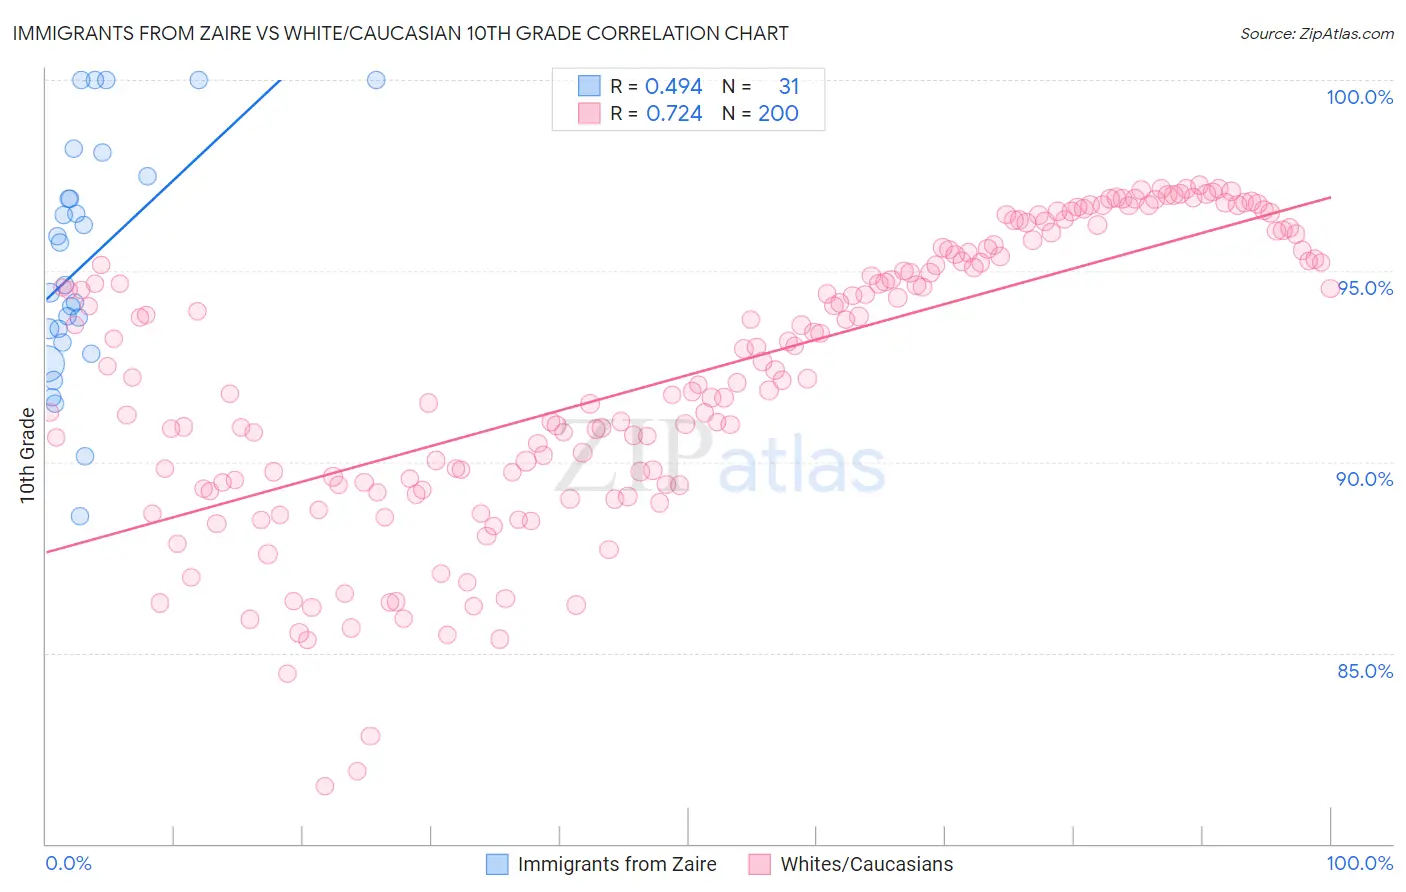
Immigrants from Zaire vs White/Caucasian 10th Grade Correlation Chart
The statistical analysis conducted on geographies consisting of 107,212,695 people shows a moderate positive correlation between the proportion of Immigrants from Zaire and percentage of population with at least 10th grade education in the United States with a correlation coefficient (R) of 0.494 and weighted average of 93.4%. Similarly, the statistical analysis conducted on geographies consisting of 585,244,993 people shows a strong positive correlation between the proportion of Whites/Caucasians and percentage of population with at least 10th grade education in the United States with a correlation coefficient (R) of 0.724 and weighted average of 94.7%, a difference of 1.3%.
10th Grade Correlation Summary
| Measurement | Immigrants from Zaire | White/Caucasian |
| Minimum | 88.6% | 81.5% |
| Maximum | 100.0% | 97.2% |
| Range | 11.4% | 15.7% |
| Mean | 95.3% | 92.3% |
| Median | 94.6% | 92.6% |
| Interquartile 25% (IQ1) | 93.1% | 89.5% |
| Interquartile 75% (IQ3) | 97.5% | 95.5% |
| Interquartile Range (IQR) | 4.4% | 6.1% |
| Standard Deviation (Sample) | 3.1% | 3.7% |
| Standard Deviation (Population) | 3.0% | 3.7% |
Similar Demographics by 10th Grade
Demographics Similar to Immigrants from Zaire by 10th Grade
In terms of 10th grade, the demographic groups most similar to Immigrants from Zaire are Cajun (93.4%, a difference of 0.0%), Indian (Asian) (93.4%, a difference of 0.010%), Immigrants from Asia (93.4%, a difference of 0.020%), Immigrants from Bahamas (93.4%, a difference of 0.020%), and Immigrants from Chile (93.4%, a difference of 0.030%).
| Demographics | Rating | Rank | 10th Grade |
| Immigrants | Indonesia | 20.2 /100 | #205 | Fair 93.4% |
| Immigrants | Sudan | 20.0 /100 | #206 | Fair 93.4% |
| Samoans | 19.5 /100 | #207 | Poor 93.4% |
| Immigrants | Syria | 19.4 /100 | #208 | Poor 93.4% |
| Immigrants | Chile | 18.8 /100 | #209 | Poor 93.4% |
| Indians (Asian) | 17.6 /100 | #210 | Poor 93.4% |
| Cajuns | 16.9 /100 | #211 | Poor 93.4% |
| Immigrants | Zaire | 16.7 /100 | #212 | Poor 93.4% |
| Immigrants | Asia | 15.7 /100 | #213 | Poor 93.4% |
| Immigrants | Bahamas | 15.2 /100 | #214 | Poor 93.4% |
| Immigrants | Oceania | 15.1 /100 | #215 | Poor 93.4% |
| Immigrants | Eastern Africa | 14.7 /100 | #216 | Poor 93.4% |
| Portuguese | 12.1 /100 | #217 | Poor 93.3% |
| Immigrants | Liberia | 10.2 /100 | #218 | Poor 93.3% |
| Seminole | 10.2 /100 | #219 | Poor 93.3% |
Demographics Similar to Whites/Caucasians by 10th Grade
In terms of 10th grade, the demographic groups most similar to Whites/Caucasians are South African (94.7%, a difference of 0.010%), Immigrants from Moldova (94.7%, a difference of 0.020%), Immigrants from Japan (94.7%, a difference of 0.030%), Immigrants from Saudi Arabia (94.7%, a difference of 0.040%), and Icelander (94.7%, a difference of 0.050%).
| Demographics | Rating | Rank | 10th Grade |
| Icelanders | 99.1 /100 | #84 | Exceptional 94.7% |
| Crow | 99.0 /100 | #85 | Exceptional 94.7% |
| Puget Sound Salish | 99.0 /100 | #86 | Exceptional 94.7% |
| Immigrants | Saudi Arabia | 99.0 /100 | #87 | Exceptional 94.7% |
| Immigrants | Japan | 99.0 /100 | #88 | Exceptional 94.7% |
| Immigrants | Moldova | 98.9 /100 | #89 | Exceptional 94.7% |
| South Africans | 98.8 /100 | #90 | Exceptional 94.7% |
| Whites/Caucasians | 98.8 /100 | #91 | Exceptional 94.7% |
| Yugoslavians | 98.4 /100 | #92 | Exceptional 94.6% |
| Soviet Union | 98.3 /100 | #93 | Exceptional 94.6% |
| Immigrants | Germany | 98.3 /100 | #94 | Exceptional 94.6% |
| Menominee | 98.3 /100 | #95 | Exceptional 94.6% |
| Immigrants | Switzerland | 98.3 /100 | #96 | Exceptional 94.6% |
| Lebanese | 98.3 /100 | #97 | Exceptional 94.6% |
| Immigrants | Bulgaria | 98.1 /100 | #98 | Exceptional 94.6% |