Immigrants from Zaire vs Polish 10th Grade
COMPARE
Immigrants from Zaire
Polish
10th Grade
10th Grade Comparison
Immigrants from Zaire
Poles
93.4%
10TH GRADE
16.7/ 100
METRIC RATING
212th/ 347
METRIC RANK
95.8%
10TH GRADE
100.0/ 100
METRIC RATING
6th/ 347
METRIC RANK
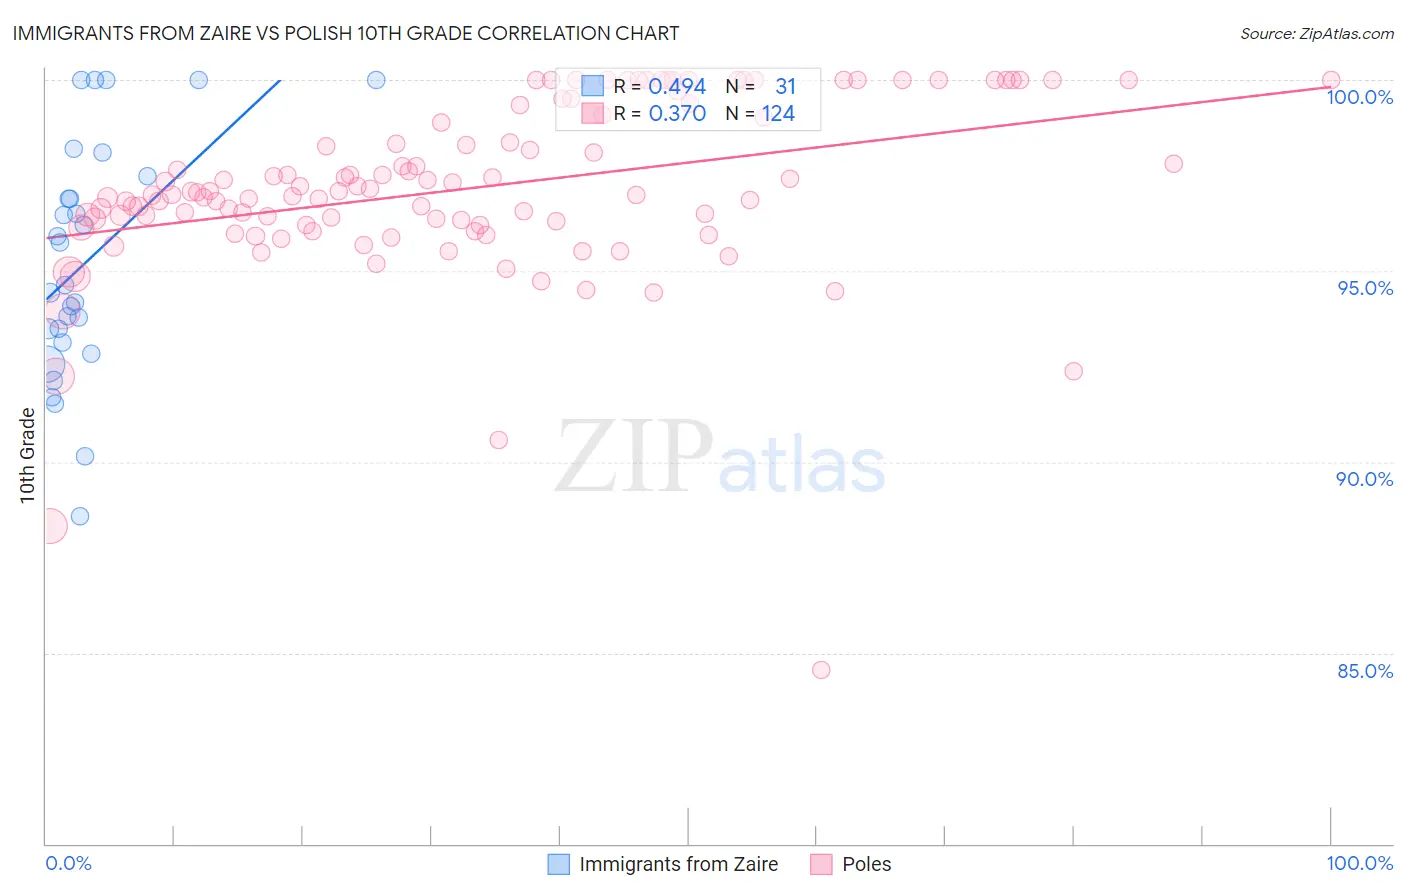
Immigrants from Zaire vs Polish 10th Grade Correlation Chart
The statistical analysis conducted on geographies consisting of 107,212,695 people shows a moderate positive correlation between the proportion of Immigrants from Zaire and percentage of population with at least 10th grade education in the United States with a correlation coefficient (R) of 0.494 and weighted average of 93.4%. Similarly, the statistical analysis conducted on geographies consisting of 560,594,575 people shows a mild positive correlation between the proportion of Poles and percentage of population with at least 10th grade education in the United States with a correlation coefficient (R) of 0.370 and weighted average of 95.8%, a difference of 2.6%.
10th Grade Correlation Summary
| Measurement | Immigrants from Zaire | Polish |
| Minimum | 88.6% | 84.5% |
| Maximum | 100.0% | 100.0% |
| Range | 11.4% | 15.5% |
| Mean | 95.3% | 97.2% |
| Median | 94.6% | 97.0% |
| Interquartile 25% (IQ1) | 93.1% | 96.2% |
| Interquartile 75% (IQ3) | 97.5% | 99.0% |
| Interquartile Range (IQR) | 4.4% | 2.8% |
| Standard Deviation (Sample) | 3.1% | 2.3% |
| Standard Deviation (Population) | 3.0% | 2.3% |
Similar Demographics by 10th Grade
Demographics Similar to Immigrants from Zaire by 10th Grade
In terms of 10th grade, the demographic groups most similar to Immigrants from Zaire are Cajun (93.4%, a difference of 0.0%), Indian (Asian) (93.4%, a difference of 0.010%), Immigrants from Asia (93.4%, a difference of 0.020%), Immigrants from Bahamas (93.4%, a difference of 0.020%), and Immigrants from Chile (93.4%, a difference of 0.030%).
| Demographics | Rating | Rank | 10th Grade |
| Immigrants | Indonesia | 20.2 /100 | #205 | Fair 93.4% |
| Immigrants | Sudan | 20.0 /100 | #206 | Fair 93.4% |
| Samoans | 19.5 /100 | #207 | Poor 93.4% |
| Immigrants | Syria | 19.4 /100 | #208 | Poor 93.4% |
| Immigrants | Chile | 18.8 /100 | #209 | Poor 93.4% |
| Indians (Asian) | 17.6 /100 | #210 | Poor 93.4% |
| Cajuns | 16.9 /100 | #211 | Poor 93.4% |
| Immigrants | Zaire | 16.7 /100 | #212 | Poor 93.4% |
| Immigrants | Asia | 15.7 /100 | #213 | Poor 93.4% |
| Immigrants | Bahamas | 15.2 /100 | #214 | Poor 93.4% |
| Immigrants | Oceania | 15.1 /100 | #215 | Poor 93.4% |
| Immigrants | Eastern Africa | 14.7 /100 | #216 | Poor 93.4% |
| Portuguese | 12.1 /100 | #217 | Poor 93.3% |
| Immigrants | Liberia | 10.2 /100 | #218 | Poor 93.3% |
| Seminole | 10.2 /100 | #219 | Poor 93.3% |
Demographics Similar to Poles by 10th Grade
In terms of 10th grade, the demographic groups most similar to Poles are German (95.8%, a difference of 0.010%), Lithuanian (95.8%, a difference of 0.030%), Finnish (95.8%, a difference of 0.080%), Carpatho Rusyn (95.9%, a difference of 0.10%), and Croatian (95.7%, a difference of 0.10%).
| Demographics | Rating | Rank | 10th Grade |
| Norwegians | 100.0 /100 | #1 | Exceptional 96.2% |
| Slovaks | 100.0 /100 | #2 | Exceptional 96.0% |
| Slovenes | 100.0 /100 | #3 | Exceptional 95.9% |
| Swedes | 100.0 /100 | #4 | Exceptional 95.9% |
| Carpatho Rusyns | 100.0 /100 | #5 | Exceptional 95.9% |
| Poles | 100.0 /100 | #6 | Exceptional 95.8% |
| Germans | 100.0 /100 | #7 | Exceptional 95.8% |
| Lithuanians | 100.0 /100 | #8 | Exceptional 95.8% |
| Finns | 100.0 /100 | #9 | Exceptional 95.8% |
| Croatians | 100.0 /100 | #10 | Exceptional 95.7% |
| Danes | 100.0 /100 | #11 | Exceptional 95.7% |
| Tlingit-Haida | 100.0 /100 | #12 | Exceptional 95.7% |
| English | 100.0 /100 | #13 | Exceptional 95.6% |
| Tsimshian | 100.0 /100 | #14 | Exceptional 95.6% |
| Irish | 100.0 /100 | #15 | Exceptional 95.6% |