Spanish American Indian vs Immigrants from Cuba 10th Grade
COMPARE
Spanish American Indian
Immigrants from Cuba
10th Grade
10th Grade Comparison
Spanish American Indians
Immigrants from Cuba
86.2%
10TH GRADE
0.0/ 100
METRIC RATING
346th/ 347
METRIC RANK
90.2%
10TH GRADE
0.0/ 100
METRIC RATING
318th/ 347
METRIC RANK
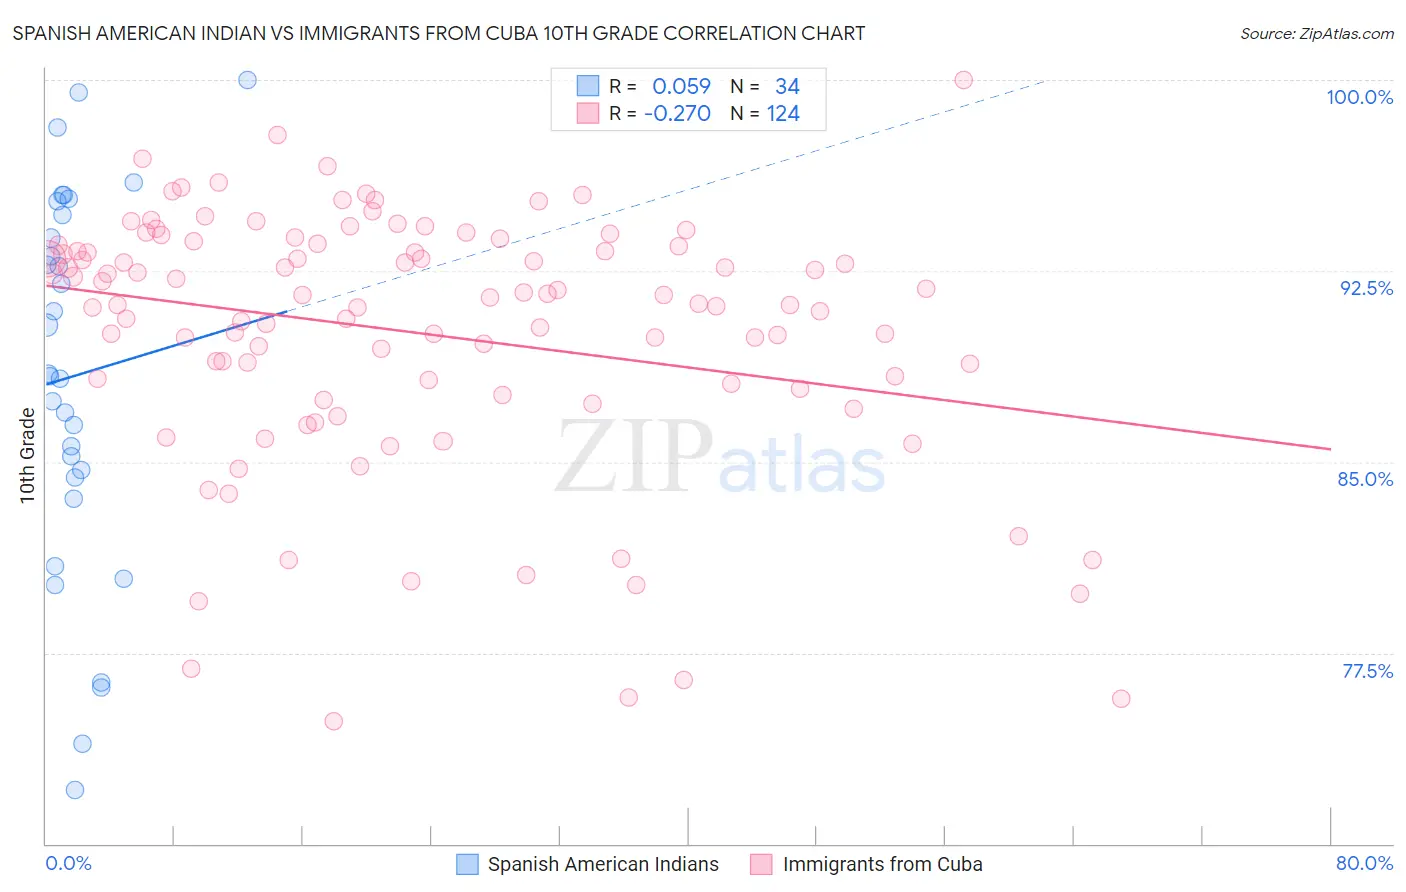
Spanish American Indian vs Immigrants from Cuba 10th Grade Correlation Chart
The statistical analysis conducted on geographies consisting of 73,147,813 people shows a slight positive correlation between the proportion of Spanish American Indians and percentage of population with at least 10th grade education in the United States with a correlation coefficient (R) of 0.059 and weighted average of 86.2%. Similarly, the statistical analysis conducted on geographies consisting of 326,019,170 people shows a weak negative correlation between the proportion of Immigrants from Cuba and percentage of population with at least 10th grade education in the United States with a correlation coefficient (R) of -0.270 and weighted average of 90.2%, a difference of 4.7%.
10th Grade Correlation Summary
| Measurement | Spanish American Indian | Immigrants from Cuba |
| Minimum | 72.1% | 74.8% |
| Maximum | 100.0% | 100.0% |
| Range | 27.9% | 25.2% |
| Mean | 88.4% | 90.1% |
| Median | 88.4% | 91.3% |
| Interquartile 25% (IQ1) | 84.4% | 88.0% |
| Interquartile 75% (IQ3) | 94.7% | 93.5% |
| Interquartile Range (IQR) | 10.3% | 5.5% |
| Standard Deviation (Sample) | 7.4% | 5.0% |
| Standard Deviation (Population) | 7.3% | 5.0% |
Similar Demographics by 10th Grade
Demographics Similar to Spanish American Indians by 10th Grade
In terms of 10th grade, the demographic groups most similar to Spanish American Indians are Immigrants from Mexico (86.2%, a difference of 0.010%), Immigrants from Central America (86.6%, a difference of 0.45%), Immigrants from El Salvador (86.8%, a difference of 0.63%), Yakama (86.9%, a difference of 0.77%), and Immigrants from Guatemala (87.4%, a difference of 1.4%).
| Demographics | Rating | Rank | 10th Grade |
| Hondurans | 0.0 /100 | #333 | Tragic 89.0% |
| Hispanics or Latinos | 0.0 /100 | #334 | Tragic 88.9% |
| Immigrants | Dominican Republic | 0.0 /100 | #335 | Tragic 88.7% |
| Immigrants | Honduras | 0.0 /100 | #336 | Tragic 88.5% |
| Central Americans | 0.0 /100 | #337 | Tragic 88.4% |
| Immigrants | Latin America | 0.0 /100 | #338 | Tragic 88.3% |
| Guatemalans | 0.0 /100 | #339 | Tragic 87.9% |
| Mexicans | 0.0 /100 | #340 | Tragic 87.8% |
| Salvadorans | 0.0 /100 | #341 | Tragic 87.5% |
| Immigrants | Guatemala | 0.0 /100 | #342 | Tragic 87.4% |
| Yakama | 0.0 /100 | #343 | Tragic 86.9% |
| Immigrants | El Salvador | 0.0 /100 | #344 | Tragic 86.8% |
| Immigrants | Central America | 0.0 /100 | #345 | Tragic 86.6% |
| Spanish American Indians | 0.0 /100 | #346 | Tragic 86.2% |
| Immigrants | Mexico | 0.0 /100 | #347 | Tragic 86.2% |
Demographics Similar to Immigrants from Cuba by 10th Grade
In terms of 10th grade, the demographic groups most similar to Immigrants from Cuba are Nicaraguan (90.2%, a difference of 0.080%), Houma (90.2%, a difference of 0.090%), Belizean (90.2%, a difference of 0.090%), Tohono O'odham (90.1%, a difference of 0.10%), and Immigrants from Belize (90.1%, a difference of 0.19%).
| Demographics | Rating | Rank | 10th Grade |
| Immigrants | Cambodia | 0.0 /100 | #311 | Tragic 90.9% |
| Immigrants | Portugal | 0.0 /100 | #312 | Tragic 90.8% |
| Cape Verdeans | 0.0 /100 | #313 | Tragic 90.8% |
| Nepalese | 0.0 /100 | #314 | Tragic 90.7% |
| Immigrants | Caribbean | 0.0 /100 | #315 | Tragic 90.6% |
| Ecuadorians | 0.0 /100 | #316 | Tragic 90.6% |
| Immigrants | Ecuador | 0.0 /100 | #317 | Tragic 90.4% |
| Immigrants | Cuba | 0.0 /100 | #318 | Tragic 90.2% |
| Nicaraguans | 0.0 /100 | #319 | Tragic 90.2% |
| Houma | 0.0 /100 | #320 | Tragic 90.2% |
| Belizeans | 0.0 /100 | #321 | Tragic 90.2% |
| Tohono O'odham | 0.0 /100 | #322 | Tragic 90.1% |
| Immigrants | Belize | 0.0 /100 | #323 | Tragic 90.1% |
| Immigrants | Armenia | 0.0 /100 | #324 | Tragic 89.9% |
| Puerto Ricans | 0.0 /100 | #325 | Tragic 89.8% |