Immigrants from Yemen vs Immigrants from Pakistan Master's Degree
COMPARE
Immigrants from Yemen
Immigrants from Pakistan
Master's Degree
Master's Degree Comparison
Immigrants from Yemen
Immigrants from Pakistan
11.6%
MASTER'S DEGREE
0.1/ 100
METRIC RATING
297th/ 347
METRIC RANK
17.8%
MASTER'S DEGREE
99.7/ 100
METRIC RATING
71st/ 347
METRIC RANK
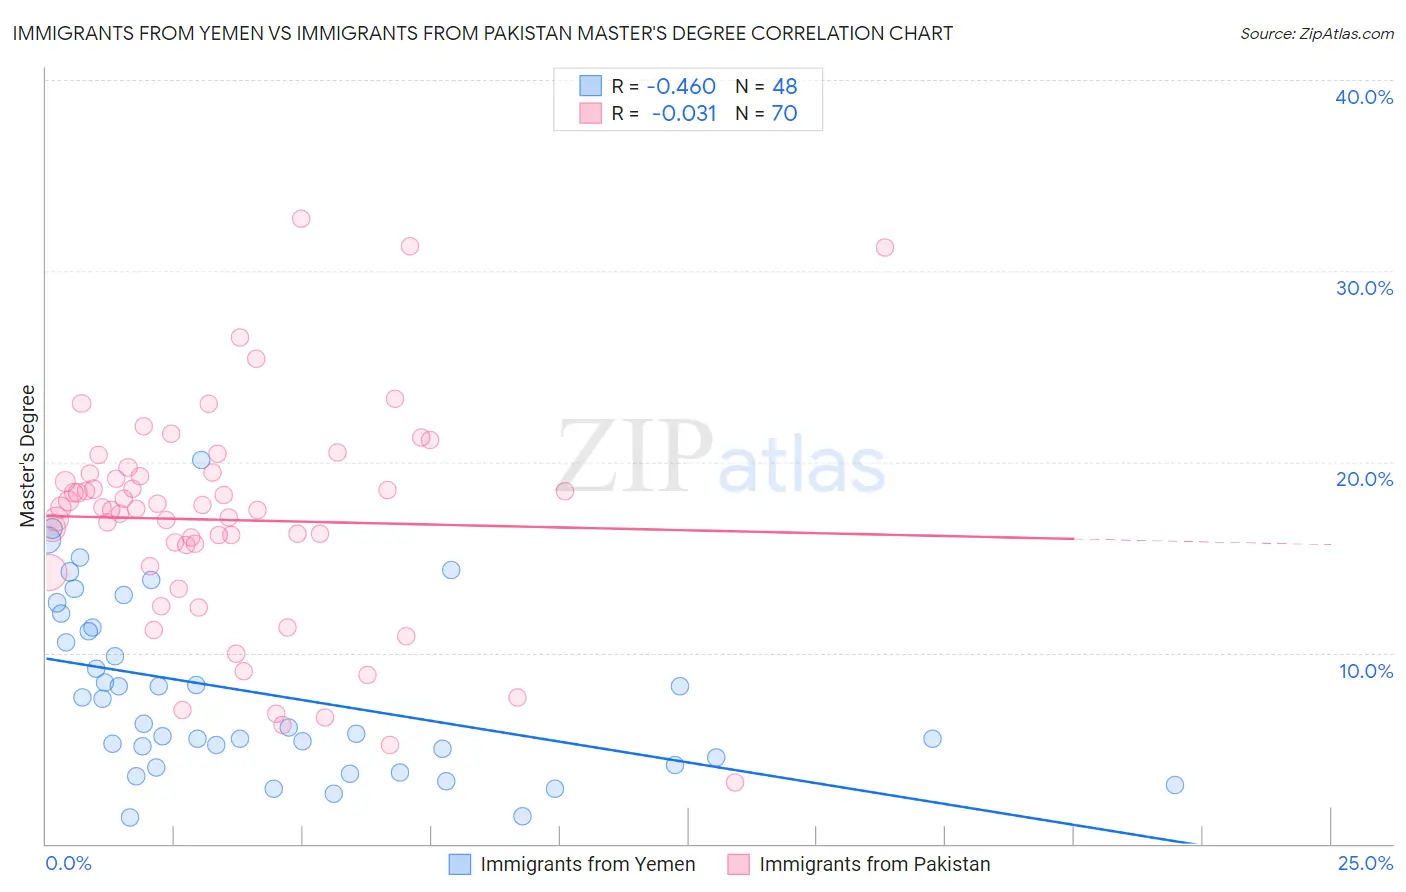
Immigrants from Yemen vs Immigrants from Pakistan Master's Degree Correlation Chart
The statistical analysis conducted on geographies consisting of 82,412,515 people shows a moderate negative correlation between the proportion of Immigrants from Yemen and percentage of population with at least master's degree education in the United States with a correlation coefficient (R) of -0.460 and weighted average of 11.6%. Similarly, the statistical analysis conducted on geographies consisting of 283,872,372 people shows no correlation between the proportion of Immigrants from Pakistan and percentage of population with at least master's degree education in the United States with a correlation coefficient (R) of -0.031 and weighted average of 17.8%, a difference of 53.8%.
Master's Degree Correlation Summary
| Measurement | Immigrants from Yemen | Immigrants from Pakistan |
| Minimum | 1.3% | 3.2% |
| Maximum | 20.1% | 32.7% |
| Range | 18.7% | 29.5% |
| Mean | 7.8% | 17.0% |
| Median | 6.2% | 17.6% |
| Interquartile 25% (IQ1) | 4.3% | 14.5% |
| Interquartile 75% (IQ3) | 11.2% | 19.4% |
| Interquartile Range (IQR) | 6.9% | 4.9% |
| Standard Deviation (Sample) | 4.5% | 5.8% |
| Standard Deviation (Population) | 4.5% | 5.7% |
Similar Demographics by Master's Degree
Demographics Similar to Immigrants from Yemen by Master's Degree
In terms of master's degree, the demographic groups most similar to Immigrants from Yemen are Alaskan Athabascan (11.6%, a difference of 0.12%), Marshallese (11.6%, a difference of 0.13%), Hawaiian (11.6%, a difference of 0.28%), Alaska Native (11.6%, a difference of 0.38%), and Immigrants from Guatemala (11.6%, a difference of 0.61%).
| Demographics | Rating | Rank | Master's Degree |
| Ute | 0.1 /100 | #290 | Tragic 11.7% |
| Colville | 0.1 /100 | #291 | Tragic 11.6% |
| Immigrants | Guatemala | 0.1 /100 | #292 | Tragic 11.6% |
| Alaska Natives | 0.1 /100 | #293 | Tragic 11.6% |
| Hawaiians | 0.1 /100 | #294 | Tragic 11.6% |
| Marshallese | 0.1 /100 | #295 | Tragic 11.6% |
| Alaskan Athabascans | 0.1 /100 | #296 | Tragic 11.6% |
| Immigrants | Yemen | 0.1 /100 | #297 | Tragic 11.6% |
| Samoans | 0.1 /100 | #298 | Tragic 11.5% |
| Chickasaw | 0.1 /100 | #299 | Tragic 11.4% |
| Chippewa | 0.1 /100 | #300 | Tragic 11.4% |
| Tsimshian | 0.1 /100 | #301 | Tragic 11.4% |
| Cherokee | 0.1 /100 | #302 | Tragic 11.4% |
| Immigrants | Laos | 0.1 /100 | #303 | Tragic 11.4% |
| Immigrants | Cabo Verde | 0.1 /100 | #304 | Tragic 11.3% |
Demographics Similar to Immigrants from Pakistan by Master's Degree
In terms of master's degree, the demographic groups most similar to Immigrants from Pakistan are Lithuanian (17.7%, a difference of 0.17%), Immigrants from Western Europe (17.8%, a difference of 0.28%), Zimbabwean (17.7%, a difference of 0.28%), Immigrants from Uzbekistan (17.9%, a difference of 0.50%), and Immigrants from Romania (17.7%, a difference of 0.59%).
| Demographics | Rating | Rank | Master's Degree |
| South Africans | 99.9 /100 | #64 | Exceptional 18.1% |
| Immigrants | Kazakhstan | 99.8 /100 | #65 | Exceptional 18.0% |
| Ethiopians | 99.8 /100 | #66 | Exceptional 18.0% |
| Immigrants | Argentina | 99.8 /100 | #67 | Exceptional 18.0% |
| Immigrants | Ethiopia | 99.8 /100 | #68 | Exceptional 17.9% |
| Immigrants | Uzbekistan | 99.8 /100 | #69 | Exceptional 17.9% |
| Immigrants | Western Europe | 99.8 /100 | #70 | Exceptional 17.8% |
| Immigrants | Pakistan | 99.7 /100 | #71 | Exceptional 17.8% |
| Lithuanians | 99.7 /100 | #72 | Exceptional 17.7% |
| Zimbabweans | 99.7 /100 | #73 | Exceptional 17.7% |
| Immigrants | Romania | 99.7 /100 | #74 | Exceptional 17.7% |
| Egyptians | 99.6 /100 | #75 | Exceptional 17.6% |
| Immigrants | Indonesia | 99.6 /100 | #76 | Exceptional 17.6% |
| Immigrants | Eastern Europe | 99.6 /100 | #77 | Exceptional 17.6% |
| Immigrants | Hungary | 99.6 /100 | #78 | Exceptional 17.5% |