Immigrants from Yemen vs Choctaw Master's Degree
COMPARE
Immigrants from Yemen
Choctaw
Master's Degree
Master's Degree Comparison
Immigrants from Yemen
Choctaw
11.6%
MASTER'S DEGREE
0.1/ 100
METRIC RATING
297th/ 347
METRIC RANK
11.0%
MASTER'S DEGREE
0.0/ 100
METRIC RATING
312th/ 347
METRIC RANK
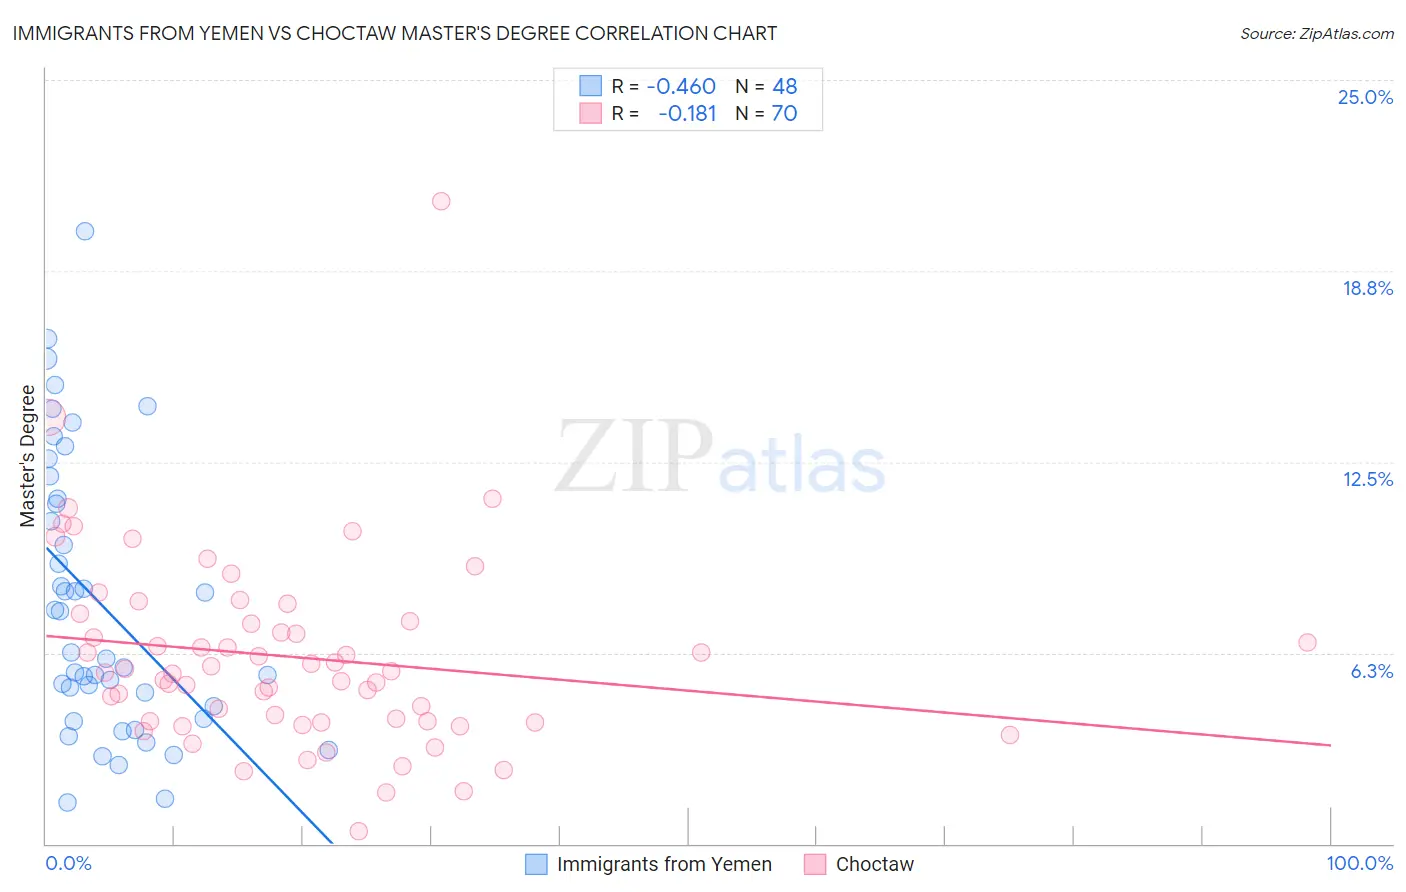
Immigrants from Yemen vs Choctaw Master's Degree Correlation Chart
The statistical analysis conducted on geographies consisting of 82,412,515 people shows a moderate negative correlation between the proportion of Immigrants from Yemen and percentage of population with at least master's degree education in the United States with a correlation coefficient (R) of -0.460 and weighted average of 11.6%. Similarly, the statistical analysis conducted on geographies consisting of 269,630,236 people shows a poor negative correlation between the proportion of Choctaw and percentage of population with at least master's degree education in the United States with a correlation coefficient (R) of -0.181 and weighted average of 11.0%, a difference of 4.8%.
Master's Degree Correlation Summary
| Measurement | Immigrants from Yemen | Choctaw |
| Minimum | 1.3% | 0.41% |
| Maximum | 20.1% | 21.0% |
| Range | 18.7% | 20.6% |
| Mean | 7.8% | 6.1% |
| Median | 6.2% | 5.6% |
| Interquartile 25% (IQ1) | 4.3% | 4.0% |
| Interquartile 75% (IQ3) | 11.2% | 7.3% |
| Interquartile Range (IQR) | 6.9% | 3.3% |
| Standard Deviation (Sample) | 4.5% | 3.2% |
| Standard Deviation (Population) | 4.5% | 3.1% |
Demographics Similar to Immigrants from Yemen and Choctaw by Master's Degree
In terms of master's degree, the demographic groups most similar to Immigrants from Yemen are Alaskan Athabascan (11.6%, a difference of 0.12%), Marshallese (11.6%, a difference of 0.13%), Hawaiian (11.6%, a difference of 0.28%), Samoan (11.5%, a difference of 0.71%), and Chickasaw (11.4%, a difference of 1.2%). Similarly, the demographic groups most similar to Choctaw are Seminole (11.0%, a difference of 0.10%), Yaqui (11.0%, a difference of 0.18%), Cajun (11.0%, a difference of 0.57%), Shoshone (11.1%, a difference of 0.61%), and Puget Sound Salish (11.1%, a difference of 0.97%).
| Demographics | Rating | Rank | Master's Degree |
| Hawaiians | 0.1 /100 | #294 | Tragic 11.6% |
| Marshallese | 0.1 /100 | #295 | Tragic 11.6% |
| Alaskan Athabascans | 0.1 /100 | #296 | Tragic 11.6% |
| Immigrants | Yemen | 0.1 /100 | #297 | Tragic 11.6% |
| Samoans | 0.1 /100 | #298 | Tragic 11.5% |
| Chickasaw | 0.1 /100 | #299 | Tragic 11.4% |
| Chippewa | 0.1 /100 | #300 | Tragic 11.4% |
| Tsimshian | 0.1 /100 | #301 | Tragic 11.4% |
| Cherokee | 0.1 /100 | #302 | Tragic 11.4% |
| Immigrants | Laos | 0.1 /100 | #303 | Tragic 11.4% |
| Immigrants | Cabo Verde | 0.1 /100 | #304 | Tragic 11.3% |
| Immigrants | Latin America | 0.0 /100 | #305 | Tragic 11.3% |
| Mexican American Indians | 0.0 /100 | #306 | Tragic 11.2% |
| Cheyenne | 0.0 /100 | #307 | Tragic 11.2% |
| Puerto Ricans | 0.0 /100 | #308 | Tragic 11.2% |
| Puget Sound Salish | 0.0 /100 | #309 | Tragic 11.1% |
| Shoshone | 0.0 /100 | #310 | Tragic 11.1% |
| Seminole | 0.0 /100 | #311 | Tragic 11.0% |
| Choctaw | 0.0 /100 | #312 | Tragic 11.0% |
| Yaqui | 0.0 /100 | #313 | Tragic 11.0% |
| Cajuns | 0.0 /100 | #314 | Tragic 11.0% |