Immigrants from Yemen vs Pennsylvania German Master's Degree
COMPARE
Immigrants from Yemen
Pennsylvania German
Master's Degree
Master's Degree Comparison
Immigrants from Yemen
Pennsylvania Germans
11.6%
MASTER'S DEGREE
0.1/ 100
METRIC RATING
297th/ 347
METRIC RANK
10.7%
MASTER'S DEGREE
0.0/ 100
METRIC RATING
321st/ 347
METRIC RANK
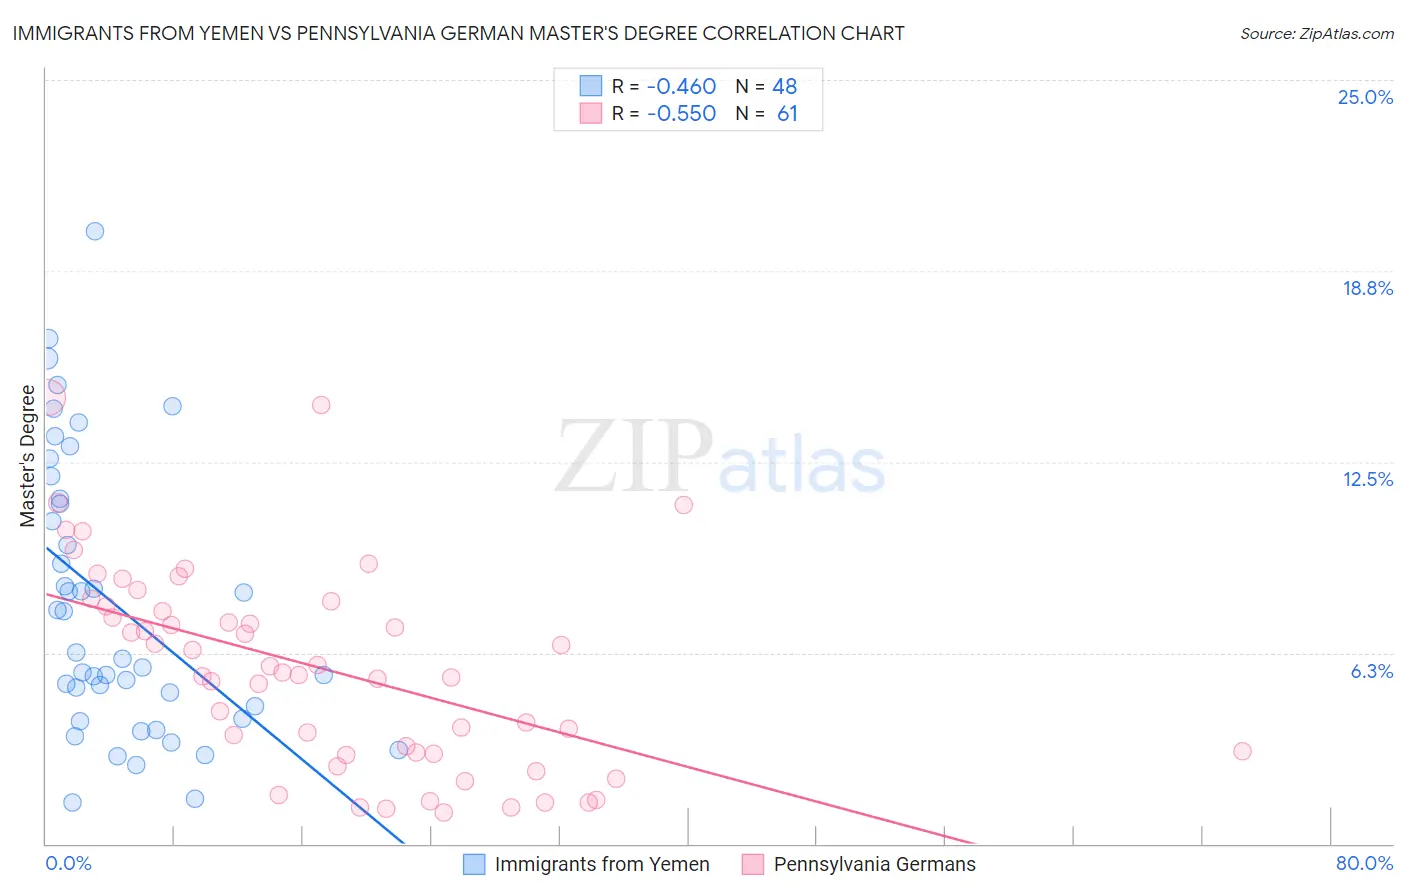
Immigrants from Yemen vs Pennsylvania German Master's Degree Correlation Chart
The statistical analysis conducted on geographies consisting of 82,412,515 people shows a moderate negative correlation between the proportion of Immigrants from Yemen and percentage of population with at least master's degree education in the United States with a correlation coefficient (R) of -0.460 and weighted average of 11.6%. Similarly, the statistical analysis conducted on geographies consisting of 234,030,574 people shows a substantial negative correlation between the proportion of Pennsylvania Germans and percentage of population with at least master's degree education in the United States with a correlation coefficient (R) of -0.550 and weighted average of 10.7%, a difference of 7.6%.
Master's Degree Correlation Summary
| Measurement | Immigrants from Yemen | Pennsylvania German |
| Minimum | 1.3% | 1.0% |
| Maximum | 20.1% | 14.6% |
| Range | 18.7% | 13.6% |
| Mean | 7.8% | 5.7% |
| Median | 6.2% | 5.6% |
| Interquartile 25% (IQ1) | 4.3% | 3.0% |
| Interquartile 75% (IQ3) | 11.2% | 7.9% |
| Interquartile Range (IQR) | 6.9% | 4.9% |
| Standard Deviation (Sample) | 4.5% | 3.3% |
| Standard Deviation (Population) | 4.5% | 3.2% |
Similar Demographics by Master's Degree
Demographics Similar to Immigrants from Yemen by Master's Degree
In terms of master's degree, the demographic groups most similar to Immigrants from Yemen are Alaskan Athabascan (11.6%, a difference of 0.12%), Marshallese (11.6%, a difference of 0.13%), Hawaiian (11.6%, a difference of 0.28%), Alaska Native (11.6%, a difference of 0.38%), and Immigrants from Guatemala (11.6%, a difference of 0.61%).
| Demographics | Rating | Rank | Master's Degree |
| Ute | 0.1 /100 | #290 | Tragic 11.7% |
| Colville | 0.1 /100 | #291 | Tragic 11.6% |
| Immigrants | Guatemala | 0.1 /100 | #292 | Tragic 11.6% |
| Alaska Natives | 0.1 /100 | #293 | Tragic 11.6% |
| Hawaiians | 0.1 /100 | #294 | Tragic 11.6% |
| Marshallese | 0.1 /100 | #295 | Tragic 11.6% |
| Alaskan Athabascans | 0.1 /100 | #296 | Tragic 11.6% |
| Immigrants | Yemen | 0.1 /100 | #297 | Tragic 11.6% |
| Samoans | 0.1 /100 | #298 | Tragic 11.5% |
| Chickasaw | 0.1 /100 | #299 | Tragic 11.4% |
| Chippewa | 0.1 /100 | #300 | Tragic 11.4% |
| Tsimshian | 0.1 /100 | #301 | Tragic 11.4% |
| Cherokee | 0.1 /100 | #302 | Tragic 11.4% |
| Immigrants | Laos | 0.1 /100 | #303 | Tragic 11.4% |
| Immigrants | Cabo Verde | 0.1 /100 | #304 | Tragic 11.3% |
Demographics Similar to Pennsylvania Germans by Master's Degree
In terms of master's degree, the demographic groups most similar to Pennsylvania Germans are Immigrants from Micronesia (10.8%, a difference of 0.21%), Sioux (10.7%, a difference of 0.64%), Kiowa (10.8%, a difference of 0.83%), Crow (10.6%, a difference of 1.0%), and Immigrants from Cuba (10.9%, a difference of 1.1%).
| Demographics | Rating | Rank | Master's Degree |
| Cajuns | 0.0 /100 | #314 | Tragic 11.0% |
| Apache | 0.0 /100 | #315 | Tragic 11.0% |
| Hispanics or Latinos | 0.0 /100 | #316 | Tragic 10.9% |
| Hopi | 0.0 /100 | #317 | Tragic 10.9% |
| Immigrants | Cuba | 0.0 /100 | #318 | Tragic 10.9% |
| Kiowa | 0.0 /100 | #319 | Tragic 10.8% |
| Immigrants | Micronesia | 0.0 /100 | #320 | Tragic 10.8% |
| Pennsylvania Germans | 0.0 /100 | #321 | Tragic 10.7% |
| Sioux | 0.0 /100 | #322 | Tragic 10.7% |
| Crow | 0.0 /100 | #323 | Tragic 10.6% |
| Dutch West Indians | 0.0 /100 | #324 | Tragic 10.6% |
| Inupiat | 0.0 /100 | #325 | Tragic 10.5% |
| Creek | 0.0 /100 | #326 | Tragic 10.5% |
| Paiute | 0.0 /100 | #327 | Tragic 10.5% |
| Bangladeshis | 0.0 /100 | #328 | Tragic 10.5% |