Immigrants from Yemen vs Arab No Schooling Completed
COMPARE
Immigrants from Yemen
Arab
No Schooling Completed
No Schooling Completed Comparison
Immigrants from Yemen
Arabs
4.1%
NO SCHOOLING COMPLETED
0.0/ 100
METRIC RATING
346th/ 347
METRIC RANK
2.1%
NO SCHOOLING COMPLETED
46.4/ 100
METRIC RATING
175th/ 347
METRIC RANK
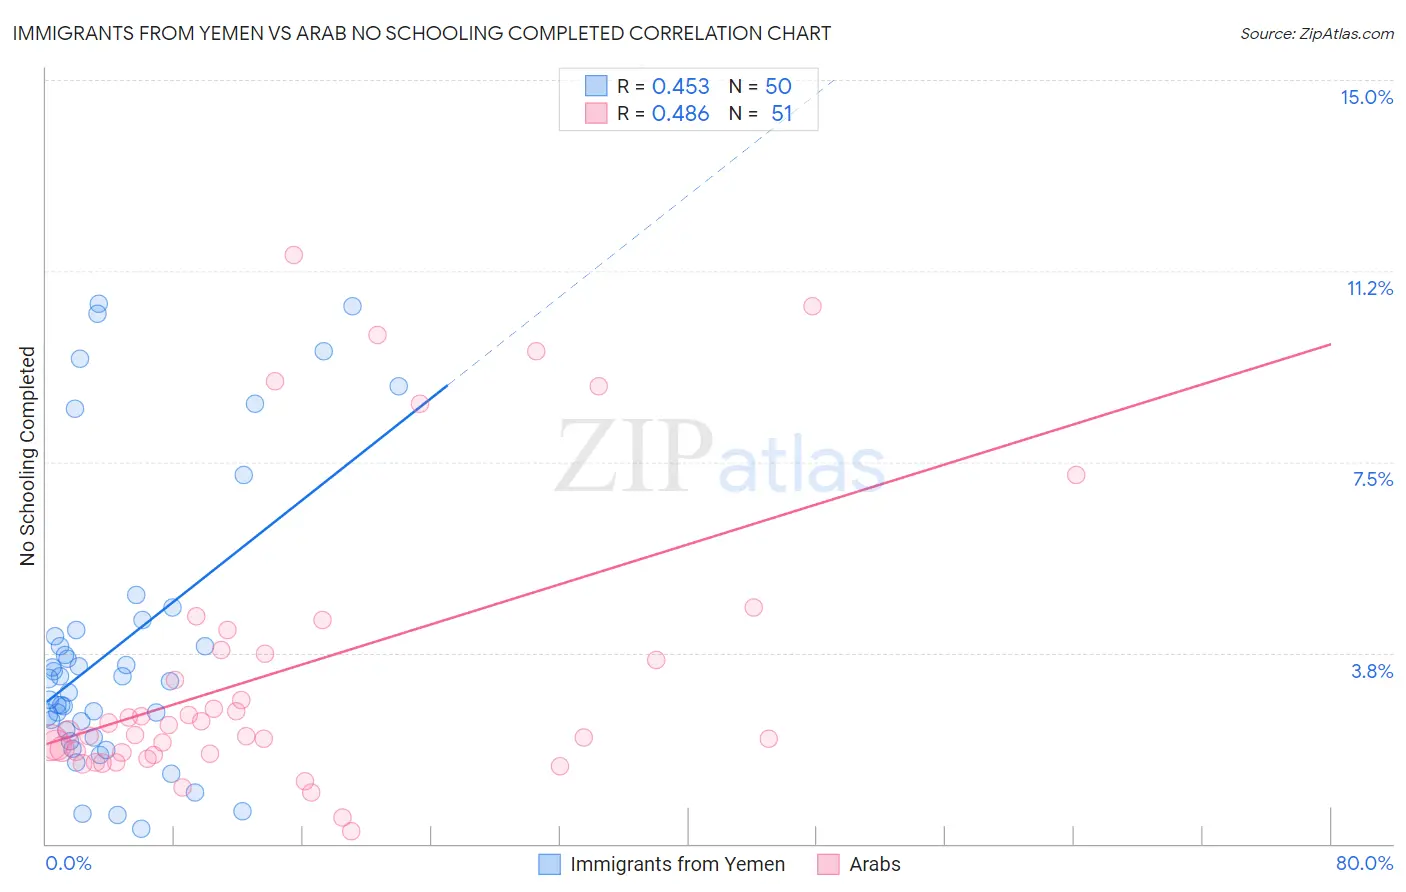
Immigrants from Yemen vs Arab No Schooling Completed Correlation Chart
The statistical analysis conducted on geographies consisting of 82,409,118 people shows a moderate positive correlation between the proportion of Immigrants from Yemen and percentage of population with no schooling in the United States with a correlation coefficient (R) of 0.453 and weighted average of 4.1%. Similarly, the statistical analysis conducted on geographies consisting of 479,384,082 people shows a moderate positive correlation between the proportion of Arabs and percentage of population with no schooling in the United States with a correlation coefficient (R) of 0.486 and weighted average of 2.1%, a difference of 96.4%.
No Schooling Completed Correlation Summary
| Measurement | Immigrants from Yemen | Arab |
| Minimum | 0.30% | 0.23% |
| Maximum | 10.6% | 11.6% |
| Range | 10.3% | 11.3% |
| Mean | 3.9% | 3.4% |
| Median | 3.2% | 2.2% |
| Interquartile 25% (IQ1) | 2.2% | 1.8% |
| Interquartile 75% (IQ3) | 4.2% | 3.8% |
| Interquartile Range (IQR) | 2.0% | 2.0% |
| Standard Deviation (Sample) | 2.8% | 2.8% |
| Standard Deviation (Population) | 2.8% | 2.8% |
Similar Demographics by No Schooling Completed
Demographics Similar to Immigrants from Yemen by No Schooling Completed
In terms of no schooling completed, the demographic groups most similar to Immigrants from Yemen are Spanish American Indian (4.2%, a difference of 1.5%), Immigrants from El Salvador (3.9%, a difference of 6.4%), Nepalese (3.8%, a difference of 8.4%), Salvadoran (3.7%, a difference of 10.2%), and Immigrants from Mexico (3.6%, a difference of 13.2%).
| Demographics | Rating | Rank | No Schooling Completed |
| Immigrants | Dominican Republic | 0.0 /100 | #333 | Tragic 3.4% |
| Guatemalans | 0.0 /100 | #334 | Tragic 3.5% |
| Immigrants | Cambodia | 0.0 /100 | #335 | Tragic 3.5% |
| Immigrants | Fiji | 0.0 /100 | #336 | Tragic 3.5% |
| Immigrants | Cabo Verde | 0.0 /100 | #337 | Tragic 3.5% |
| Bangladeshis | 0.0 /100 | #338 | Tragic 3.5% |
| Yakama | 0.0 /100 | #339 | Tragic 3.6% |
| Immigrants | Guatemala | 0.0 /100 | #340 | Tragic 3.6% |
| Immigrants | Central America | 0.0 /100 | #341 | Tragic 3.6% |
| Immigrants | Mexico | 0.0 /100 | #342 | Tragic 3.6% |
| Salvadorans | 0.0 /100 | #343 | Tragic 3.7% |
| Nepalese | 0.0 /100 | #344 | Tragic 3.8% |
| Immigrants | El Salvador | 0.0 /100 | #345 | Tragic 3.9% |
| Immigrants | Yemen | 0.0 /100 | #346 | Tragic 4.1% |
| Spanish American Indians | 0.0 /100 | #347 | Tragic 4.2% |
Demographics Similar to Arabs by No Schooling Completed
In terms of no schooling completed, the demographic groups most similar to Arabs are Panamanian (2.1%, a difference of 0.17%), Arapaho (2.1%, a difference of 0.19%), Pakistani (2.1%, a difference of 0.23%), Immigrants from Kazakhstan (2.1%, a difference of 0.29%), and Portuguese (2.1%, a difference of 0.35%).
| Demographics | Rating | Rank | No Schooling Completed |
| Cheyenne | 58.6 /100 | #168 | Average 2.1% |
| Apache | 56.7 /100 | #169 | Average 2.1% |
| Argentineans | 56.0 /100 | #170 | Average 2.1% |
| Immigrants | Poland | 55.2 /100 | #171 | Average 2.1% |
| Immigrants | Argentina | 52.7 /100 | #172 | Average 2.1% |
| Immigrants | Belarus | 51.8 /100 | #173 | Average 2.1% |
| Immigrants | Micronesia | 50.0 /100 | #174 | Average 2.1% |
| Arabs | 46.4 /100 | #175 | Average 2.1% |
| Panamanians | 45.2 /100 | #176 | Average 2.1% |
| Arapaho | 45.0 /100 | #177 | Average 2.1% |
| Pakistanis | 44.7 /100 | #178 | Average 2.1% |
| Immigrants | Kazakhstan | 44.3 /100 | #179 | Average 2.1% |
| Portuguese | 43.9 /100 | #180 | Average 2.1% |
| Immigrants | Taiwan | 42.6 /100 | #181 | Average 2.1% |
| French American Indians | 42.2 /100 | #182 | Average 2.1% |