Immigrants from Western Africa vs Guamanian/Chamorro 5th Grade
COMPARE
Immigrants from Western Africa
Guamanian/Chamorro
5th Grade
5th Grade Comparison
Immigrants from Western Africa
Guamanians/Chamorros
96.6%
5TH GRADE
0.1/ 100
METRIC RATING
280th/ 347
METRIC RANK
97.2%
5TH GRADE
26.8/ 100
METRIC RATING
195th/ 347
METRIC RANK
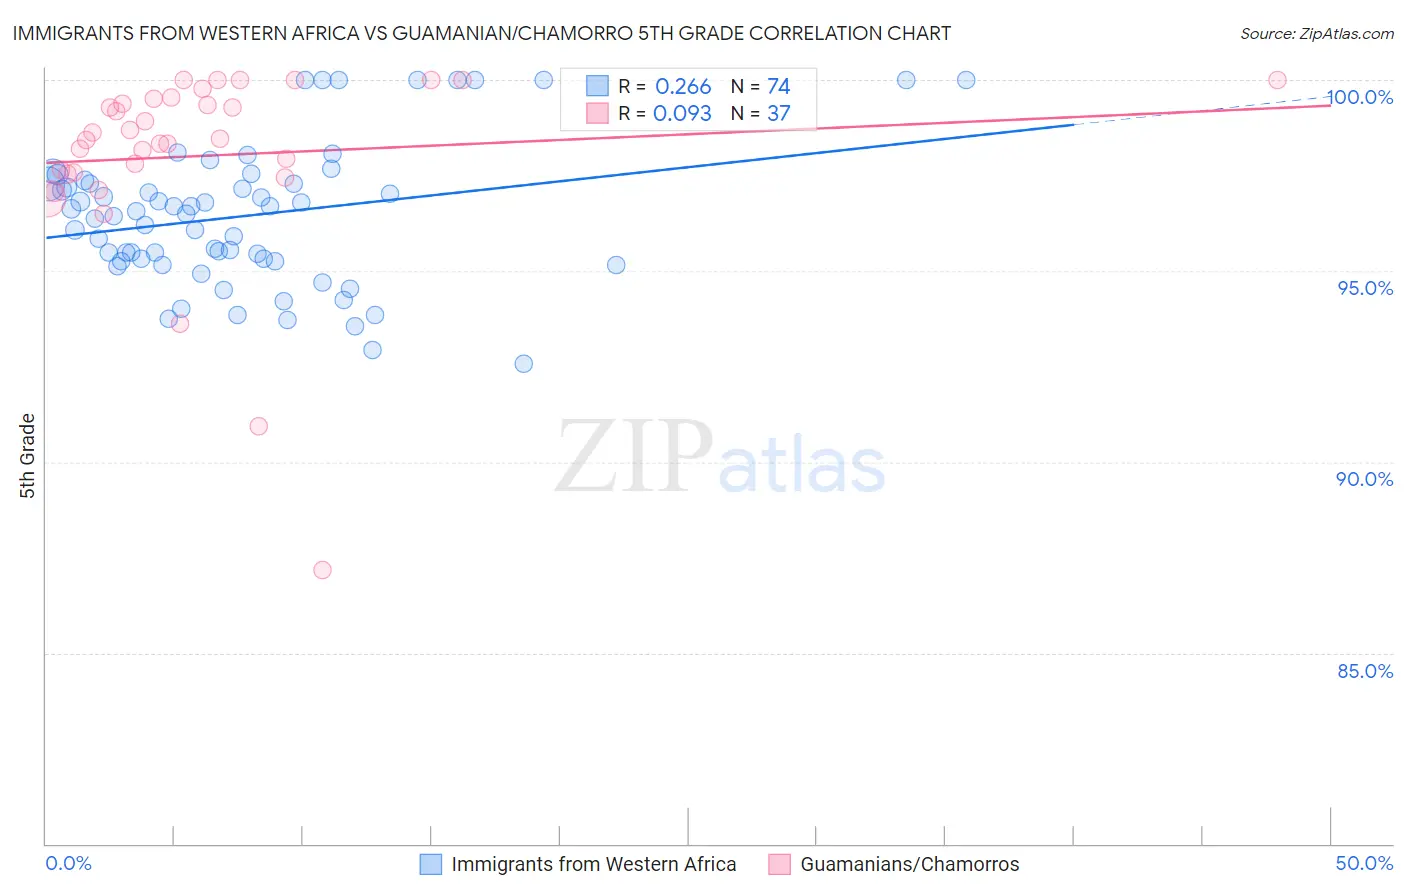
Immigrants from Western Africa vs Guamanian/Chamorro 5th Grade Correlation Chart
The statistical analysis conducted on geographies consisting of 357,809,696 people shows a weak positive correlation between the proportion of Immigrants from Western Africa and percentage of population with at least 5th grade education in the United States with a correlation coefficient (R) of 0.266 and weighted average of 96.6%. Similarly, the statistical analysis conducted on geographies consisting of 221,965,618 people shows a slight positive correlation between the proportion of Guamanians/Chamorros and percentage of population with at least 5th grade education in the United States with a correlation coefficient (R) of 0.093 and weighted average of 97.2%, a difference of 0.63%.
5th Grade Correlation Summary
| Measurement | Immigrants from Western Africa | Guamanian/Chamorro |
| Minimum | 92.6% | 87.2% |
| Maximum | 100.0% | 100.0% |
| Range | 7.4% | 12.8% |
| Mean | 96.4% | 98.0% |
| Median | 96.5% | 98.5% |
| Interquartile 25% (IQ1) | 95.3% | 97.5% |
| Interquartile 75% (IQ3) | 97.3% | 99.5% |
| Interquartile Range (IQR) | 2.0% | 2.0% |
| Standard Deviation (Sample) | 1.8% | 2.6% |
| Standard Deviation (Population) | 1.8% | 2.5% |
Similar Demographics by 5th Grade
Demographics Similar to Immigrants from Western Africa by 5th Grade
In terms of 5th grade, the demographic groups most similar to Immigrants from Western Africa are Houma (96.6%, a difference of 0.0%), Barbadian (96.6%, a difference of 0.0%), Fijian (96.6%, a difference of 0.0%), Immigrants from Philippines (96.6%, a difference of 0.010%), and Immigrants from Trinidad and Tobago (96.6%, a difference of 0.010%).
| Demographics | Rating | Rank | 5th Grade |
| Yaqui | 0.1 /100 | #273 | Tragic 96.7% |
| Immigrants | Cameroon | 0.1 /100 | #274 | Tragic 96.7% |
| Immigrants | Peru | 0.1 /100 | #275 | Tragic 96.6% |
| Cubans | 0.1 /100 | #276 | Tragic 96.6% |
| Immigrants | Bolivia | 0.1 /100 | #277 | Tragic 96.6% |
| Immigrants | Ghana | 0.1 /100 | #278 | Tragic 96.6% |
| Immigrants | Philippines | 0.1 /100 | #279 | Tragic 96.6% |
| Immigrants | Western Africa | 0.1 /100 | #280 | Tragic 96.6% |
| Houma | 0.1 /100 | #281 | Tragic 96.6% |
| Barbadians | 0.1 /100 | #282 | Tragic 96.6% |
| Fijians | 0.1 /100 | #283 | Tragic 96.6% |
| Immigrants | Trinidad and Tobago | 0.1 /100 | #284 | Tragic 96.6% |
| Immigrants | St. Vincent and the Grenadines | 0.1 /100 | #285 | Tragic 96.6% |
| Immigrants | Thailand | 0.1 /100 | #286 | Tragic 96.6% |
| Immigrants | Afghanistan | 0.1 /100 | #287 | Tragic 96.6% |
Demographics Similar to Guamanians/Chamorros by 5th Grade
In terms of 5th grade, the demographic groups most similar to Guamanians/Chamorros are Navajo (97.2%, a difference of 0.010%), Immigrants from Albania (97.2%, a difference of 0.010%), Hawaiian (97.2%, a difference of 0.010%), Brazilian (97.2%, a difference of 0.010%), and Immigrants from Brazil (97.3%, a difference of 0.020%).
| Demographics | Rating | Rank | 5th Grade |
| Paraguayans | 33.7 /100 | #188 | Fair 97.3% |
| Immigrants | Egypt | 32.9 /100 | #189 | Fair 97.3% |
| Blacks/African Americans | 31.8 /100 | #190 | Fair 97.3% |
| Immigrants | Brazil | 31.5 /100 | #191 | Fair 97.3% |
| Panamanians | 31.3 /100 | #192 | Fair 97.3% |
| Navajo | 29.0 /100 | #193 | Fair 97.2% |
| Immigrants | Albania | 28.5 /100 | #194 | Fair 97.2% |
| Guamanians/Chamorros | 26.8 /100 | #195 | Fair 97.2% |
| Hawaiians | 25.6 /100 | #196 | Fair 97.2% |
| Brazilians | 25.4 /100 | #197 | Fair 97.2% |
| Immigrants | Uganda | 21.1 /100 | #198 | Fair 97.2% |
| Natives/Alaskans | 18.0 /100 | #199 | Poor 97.2% |
| Immigrants | Northern Africa | 16.8 /100 | #200 | Poor 97.2% |
| Immigrants | Chile | 16.6 /100 | #201 | Poor 97.2% |
| Africans | 15.3 /100 | #202 | Poor 97.2% |