Immigrants from Western Africa vs Bangladeshi 5th Grade
COMPARE
Immigrants from Western Africa
Bangladeshi
5th Grade
5th Grade Comparison
Immigrants from Western Africa
Bangladeshis
96.6%
5TH GRADE
0.1/ 100
METRIC RATING
280th/ 347
METRIC RANK
95.9%
5TH GRADE
0.0/ 100
METRIC RATING
313th/ 347
METRIC RANK
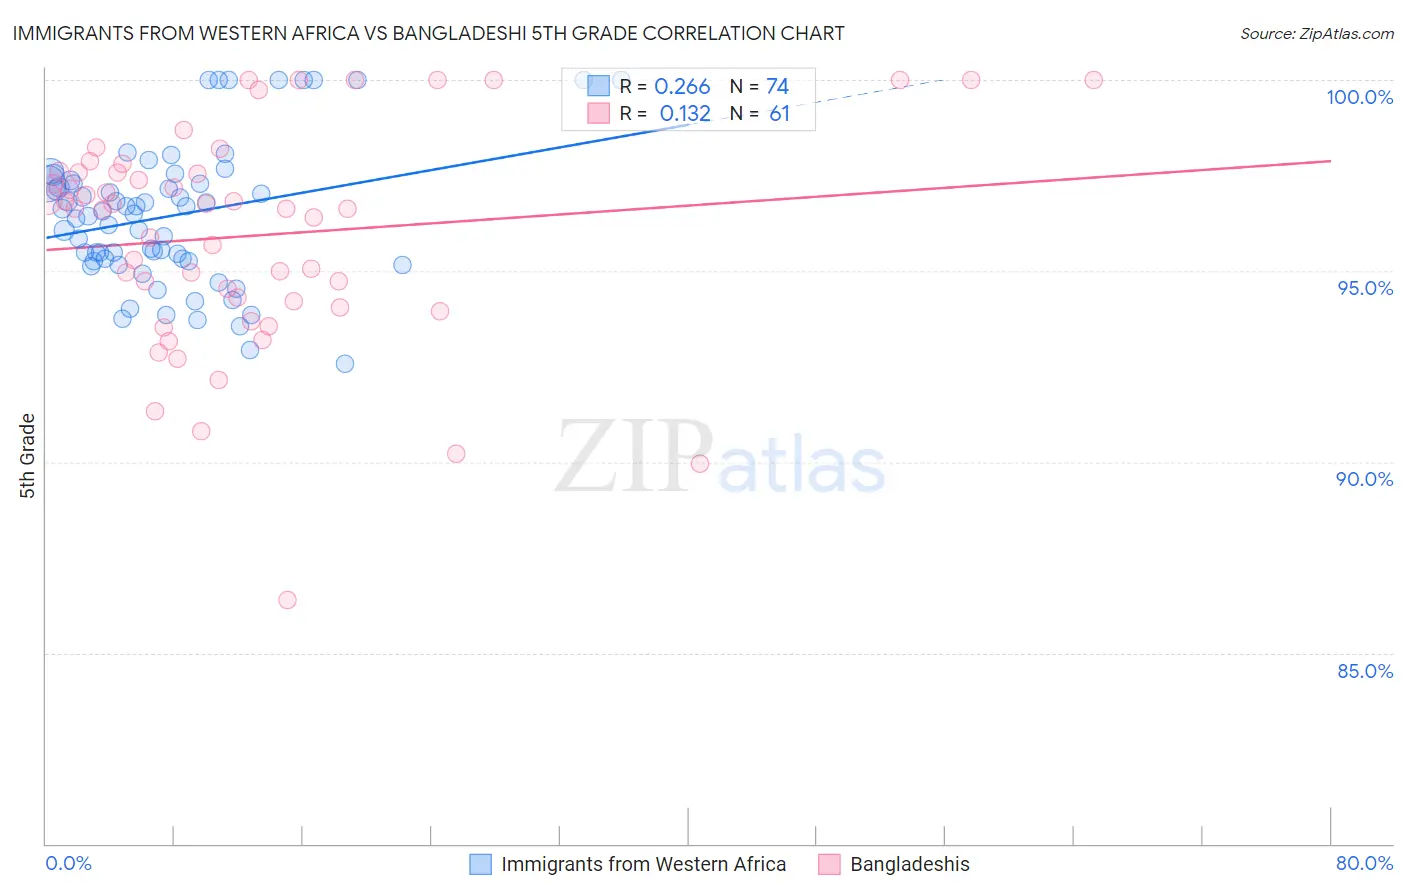
Immigrants from Western Africa vs Bangladeshi 5th Grade Correlation Chart
The statistical analysis conducted on geographies consisting of 357,809,696 people shows a weak positive correlation between the proportion of Immigrants from Western Africa and percentage of population with at least 5th grade education in the United States with a correlation coefficient (R) of 0.266 and weighted average of 96.6%. Similarly, the statistical analysis conducted on geographies consisting of 141,430,495 people shows a poor positive correlation between the proportion of Bangladeshis and percentage of population with at least 5th grade education in the United States with a correlation coefficient (R) of 0.132 and weighted average of 95.9%, a difference of 0.74%.
5th Grade Correlation Summary
| Measurement | Immigrants from Western Africa | Bangladeshi |
| Minimum | 92.6% | 86.4% |
| Maximum | 100.0% | 100.0% |
| Range | 7.4% | 13.6% |
| Mean | 96.4% | 95.9% |
| Median | 96.5% | 96.6% |
| Interquartile 25% (IQ1) | 95.3% | 94.1% |
| Interquartile 75% (IQ3) | 97.3% | 97.6% |
| Interquartile Range (IQR) | 2.0% | 3.5% |
| Standard Deviation (Sample) | 1.8% | 2.9% |
| Standard Deviation (Population) | 1.8% | 2.8% |
Similar Demographics by 5th Grade
Demographics Similar to Immigrants from Western Africa by 5th Grade
In terms of 5th grade, the demographic groups most similar to Immigrants from Western Africa are Houma (96.6%, a difference of 0.0%), Barbadian (96.6%, a difference of 0.0%), Fijian (96.6%, a difference of 0.0%), Immigrants from Philippines (96.6%, a difference of 0.010%), and Immigrants from Trinidad and Tobago (96.6%, a difference of 0.010%).
| Demographics | Rating | Rank | 5th Grade |
| Yaqui | 0.1 /100 | #273 | Tragic 96.7% |
| Immigrants | Cameroon | 0.1 /100 | #274 | Tragic 96.7% |
| Immigrants | Peru | 0.1 /100 | #275 | Tragic 96.6% |
| Cubans | 0.1 /100 | #276 | Tragic 96.6% |
| Immigrants | Bolivia | 0.1 /100 | #277 | Tragic 96.6% |
| Immigrants | Ghana | 0.1 /100 | #278 | Tragic 96.6% |
| Immigrants | Philippines | 0.1 /100 | #279 | Tragic 96.6% |
| Immigrants | Western Africa | 0.1 /100 | #280 | Tragic 96.6% |
| Houma | 0.1 /100 | #281 | Tragic 96.6% |
| Barbadians | 0.1 /100 | #282 | Tragic 96.6% |
| Fijians | 0.1 /100 | #283 | Tragic 96.6% |
| Immigrants | Trinidad and Tobago | 0.1 /100 | #284 | Tragic 96.6% |
| Immigrants | St. Vincent and the Grenadines | 0.1 /100 | #285 | Tragic 96.6% |
| Immigrants | Thailand | 0.1 /100 | #286 | Tragic 96.6% |
| Immigrants | Afghanistan | 0.1 /100 | #287 | Tragic 96.6% |
Demographics Similar to Bangladeshis by 5th Grade
In terms of 5th grade, the demographic groups most similar to Bangladeshis are Immigrants from Portugal (95.9%, a difference of 0.0%), Vietnamese (95.9%, a difference of 0.020%), Nicaraguan (95.9%, a difference of 0.020%), Immigrants from Bangladesh (96.0%, a difference of 0.050%), and Indonesian (96.0%, a difference of 0.070%).
| Demographics | Rating | Rank | 5th Grade |
| Immigrants | Haiti | 0.0 /100 | #306 | Tragic 96.0% |
| Immigrants | Caribbean | 0.0 /100 | #307 | Tragic 96.0% |
| Ecuadorians | 0.0 /100 | #308 | Tragic 96.0% |
| Immigrants | Guyana | 0.0 /100 | #309 | Tragic 96.0% |
| Indonesians | 0.0 /100 | #310 | Tragic 96.0% |
| Immigrants | Bangladesh | 0.0 /100 | #311 | Tragic 96.0% |
| Vietnamese | 0.0 /100 | #312 | Tragic 95.9% |
| Bangladeshis | 0.0 /100 | #313 | Tragic 95.9% |
| Immigrants | Portugal | 0.0 /100 | #314 | Tragic 95.9% |
| Nicaraguans | 0.0 /100 | #315 | Tragic 95.9% |
| Immigrants | Ecuador | 0.0 /100 | #316 | Tragic 95.8% |
| Belizeans | 0.0 /100 | #317 | Tragic 95.8% |
| Immigrants | Vietnam | 0.0 /100 | #318 | Tragic 95.8% |
| Japanese | 0.0 /100 | #319 | Tragic 95.7% |
| Central American Indians | 0.0 /100 | #320 | Tragic 95.7% |