Immigrants from Western Africa vs Barbadian High School Diploma
COMPARE
Immigrants from Western Africa
Barbadian
High School Diploma
High School Diploma Comparison
Immigrants from Western Africa
Barbadians
87.4%
HIGH SCHOOL DIPLOMA
0.5/ 100
METRIC RATING
259th/ 347
METRIC RANK
86.7%
HIGH SCHOOL DIPLOMA
0.1/ 100
METRIC RATING
277th/ 347
METRIC RANK
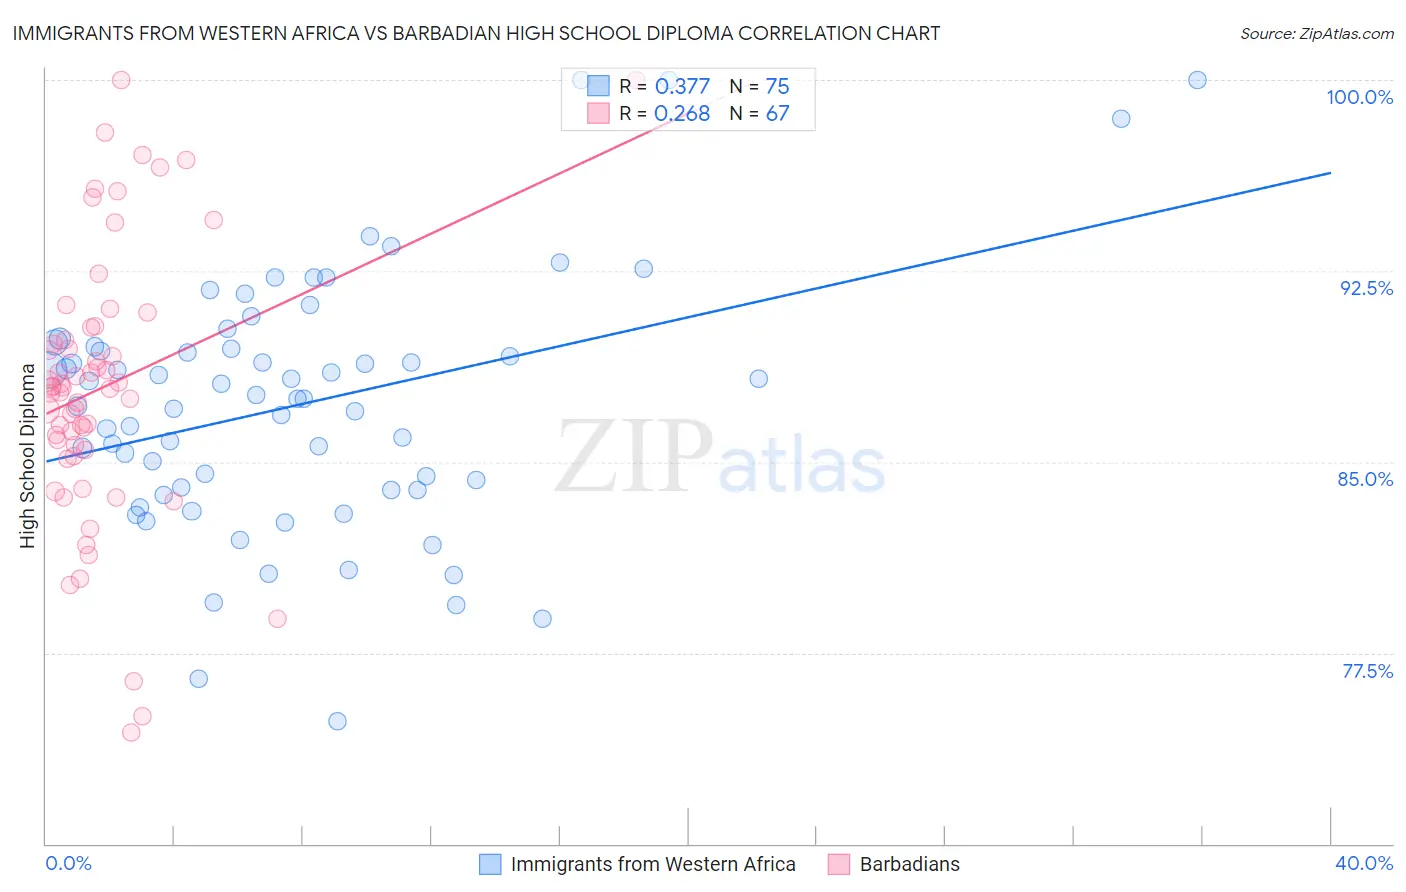
Immigrants from Western Africa vs Barbadian High School Diploma Correlation Chart
The statistical analysis conducted on geographies consisting of 357,882,128 people shows a mild positive correlation between the proportion of Immigrants from Western Africa and percentage of population with at least high school diploma education in the United States with a correlation coefficient (R) of 0.377 and weighted average of 87.4%. Similarly, the statistical analysis conducted on geographies consisting of 141,304,590 people shows a weak positive correlation between the proportion of Barbadians and percentage of population with at least high school diploma education in the United States with a correlation coefficient (R) of 0.268 and weighted average of 86.7%, a difference of 0.78%.
High School Diploma Correlation Summary
| Measurement | Immigrants from Western Africa | Barbadian |
| Minimum | 74.8% | 74.4% |
| Maximum | 100.0% | 100.0% |
| Range | 25.2% | 25.6% |
| Mean | 87.3% | 87.9% |
| Median | 87.5% | 87.9% |
| Interquartile 25% (IQ1) | 83.9% | 85.4% |
| Interquartile 75% (IQ3) | 89.5% | 90.3% |
| Interquartile Range (IQR) | 5.6% | 4.8% |
| Standard Deviation (Sample) | 5.0% | 5.4% |
| Standard Deviation (Population) | 4.9% | 5.3% |
Demographics Similar to Immigrants from Western Africa and Barbadians by High School Diploma
In terms of high school diploma, the demographic groups most similar to Immigrants from Western Africa are Immigrants from Ghana (87.4%, a difference of 0.010%), Cajun (87.3%, a difference of 0.080%), Seminole (87.3%, a difference of 0.10%), Immigrants from Peru (87.3%, a difference of 0.13%), and Immigrants from South Eastern Asia (87.2%, a difference of 0.16%). Similarly, the demographic groups most similar to Barbadians are Immigrants from Burma/Myanmar (86.7%, a difference of 0.010%), Immigrants from Trinidad and Tobago (86.8%, a difference of 0.080%), Hopi (86.6%, a difference of 0.11%), Bangladeshi (86.9%, a difference of 0.22%), and Immigrants from Jamaica (86.9%, a difference of 0.23%).
| Demographics | Rating | Rank | High School Diploma |
| Immigrants | Ghana | 0.5 /100 | #258 | Tragic 87.4% |
| Immigrants | Western Africa | 0.5 /100 | #259 | Tragic 87.4% |
| Cajuns | 0.4 /100 | #260 | Tragic 87.3% |
| Seminole | 0.4 /100 | #261 | Tragic 87.3% |
| Immigrants | Peru | 0.4 /100 | #262 | Tragic 87.3% |
| Immigrants | South Eastern Asia | 0.3 /100 | #263 | Tragic 87.2% |
| Jamaicans | 0.3 /100 | #264 | Tragic 87.2% |
| U.S. Virgin Islanders | 0.2 /100 | #265 | Tragic 87.1% |
| Immigrants | Congo | 0.2 /100 | #266 | Tragic 87.0% |
| Blacks/African Americans | 0.2 /100 | #267 | Tragic 87.0% |
| Pennsylvania Germans | 0.2 /100 | #268 | Tragic 87.0% |
| Sri Lankans | 0.2 /100 | #269 | Tragic 87.0% |
| Malaysians | 0.2 /100 | #270 | Tragic 87.0% |
| West Indians | 0.1 /100 | #271 | Tragic 86.9% |
| Trinidadians and Tobagonians | 0.1 /100 | #272 | Tragic 86.9% |
| Immigrants | Jamaica | 0.1 /100 | #273 | Tragic 86.9% |
| Bangladeshis | 0.1 /100 | #274 | Tragic 86.9% |
| Immigrants | Trinidad and Tobago | 0.1 /100 | #275 | Tragic 86.8% |
| Immigrants | Burma/Myanmar | 0.1 /100 | #276 | Tragic 86.7% |
| Barbadians | 0.1 /100 | #277 | Tragic 86.7% |
| Hopi | 0.1 /100 | #278 | Tragic 86.6% |