Immigrants from Western Africa vs Northern European Associate's Degree
COMPARE
Immigrants from Western Africa
Northern European
Associate's Degree
Associate's Degree Comparison
Immigrants from Western Africa
Northern Europeans
44.1%
ASSOCIATE'S DEGREE
6.6/ 100
METRIC RATING
221st/ 347
METRIC RANK
49.5%
ASSOCIATE'S DEGREE
97.3/ 100
METRIC RATING
101st/ 347
METRIC RANK
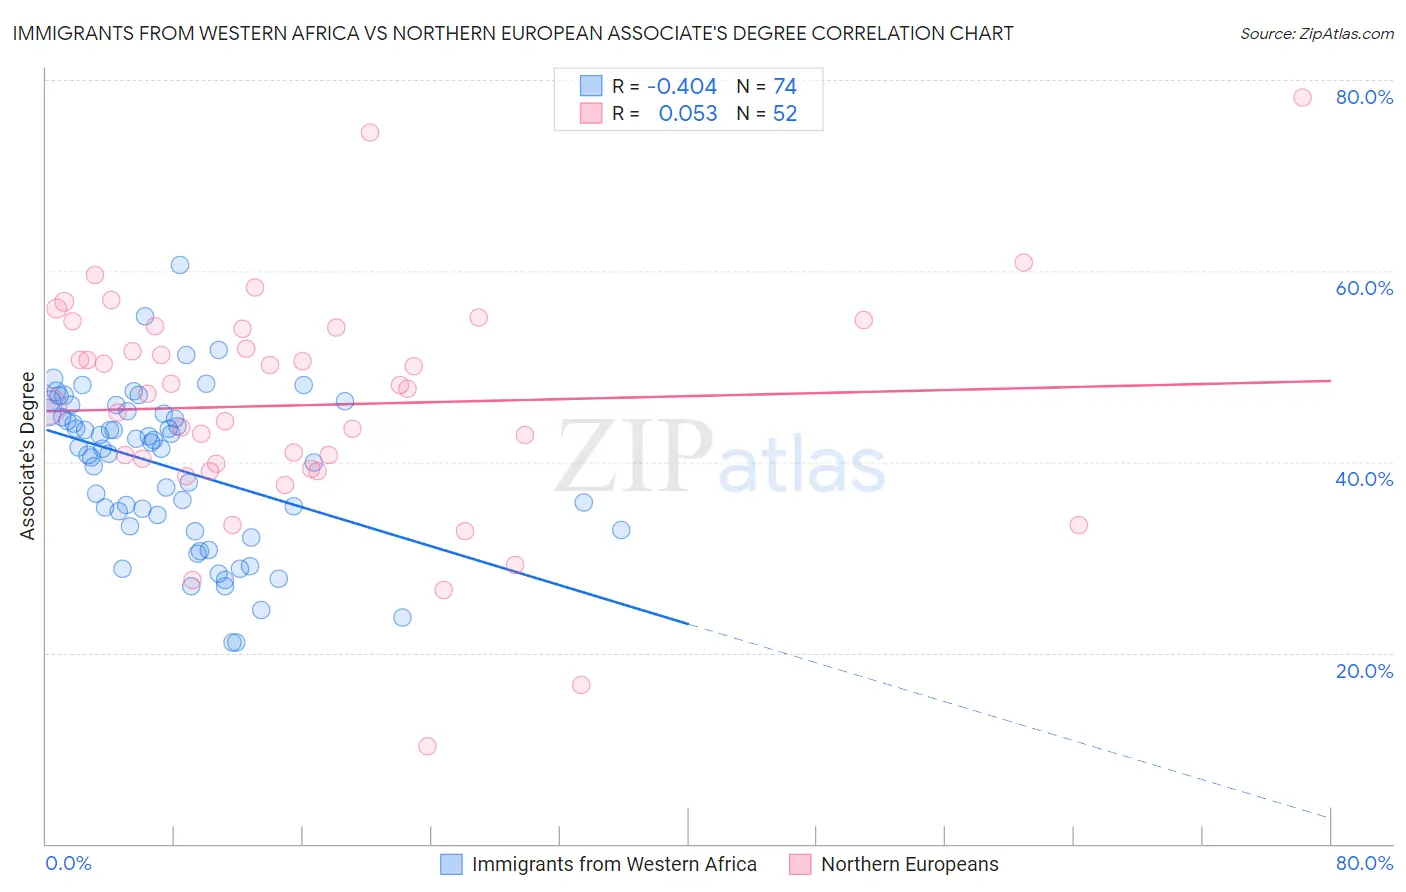
Immigrants from Western Africa vs Northern European Associate's Degree Correlation Chart
The statistical analysis conducted on geographies consisting of 357,851,677 people shows a moderate negative correlation between the proportion of Immigrants from Western Africa and percentage of population with at least associate's degree education in the United States with a correlation coefficient (R) of -0.404 and weighted average of 44.1%. Similarly, the statistical analysis conducted on geographies consisting of 406,085,887 people shows a slight positive correlation between the proportion of Northern Europeans and percentage of population with at least associate's degree education in the United States with a correlation coefficient (R) of 0.053 and weighted average of 49.5%, a difference of 12.3%.
Associate's Degree Correlation Summary
| Measurement | Immigrants from Western Africa | Northern European |
| Minimum | 21.0% | 10.2% |
| Maximum | 60.6% | 78.2% |
| Range | 39.6% | 68.0% |
| Mean | 39.4% | 46.0% |
| Median | 41.4% | 47.4% |
| Interquartile 25% (IQ1) | 33.2% | 39.6% |
| Interquartile 75% (IQ3) | 45.1% | 54.0% |
| Interquartile Range (IQR) | 11.9% | 14.4% |
| Standard Deviation (Sample) | 8.2% | 12.1% |
| Standard Deviation (Population) | 8.1% | 12.0% |
Similar Demographics by Associate's Degree
Demographics Similar to Immigrants from Western Africa by Associate's Degree
In terms of associate's degree, the demographic groups most similar to Immigrants from Western Africa are Portuguese (44.1%, a difference of 0.20%), White/Caucasian (44.2%, a difference of 0.27%), Barbadian (43.9%, a difference of 0.27%), Subsaharan African (43.9%, a difference of 0.37%), and West Indian (43.8%, a difference of 0.51%).
| Demographics | Rating | Rank | Associate's Degree |
| Immigrants | Middle Africa | 12.7 /100 | #214 | Poor 44.7% |
| Immigrants | Panama | 12.4 /100 | #215 | Poor 44.7% |
| Immigrants | Nigeria | 11.4 /100 | #216 | Poor 44.6% |
| Immigrants | Immigrants | 10.5 /100 | #217 | Poor 44.5% |
| Spanish | 9.4 /100 | #218 | Tragic 44.4% |
| Whites/Caucasians | 7.5 /100 | #219 | Tragic 44.2% |
| Portuguese | 7.2 /100 | #220 | Tragic 44.1% |
| Immigrants | Western Africa | 6.6 /100 | #221 | Tragic 44.1% |
| Barbadians | 5.8 /100 | #222 | Tragic 43.9% |
| Sub-Saharan Africans | 5.5 /100 | #223 | Tragic 43.9% |
| West Indians | 5.2 /100 | #224 | Tragic 43.8% |
| Guamanians/Chamorros | 4.8 /100 | #225 | Tragic 43.8% |
| Immigrants | Burma/Myanmar | 4.3 /100 | #226 | Tragic 43.7% |
| Trinidadians and Tobagonians | 4.0 /100 | #227 | Tragic 43.6% |
| Hmong | 3.2 /100 | #228 | Tragic 43.4% |
Demographics Similar to Northern Europeans by Associate's Degree
In terms of associate's degree, the demographic groups most similar to Northern Europeans are Chilean (49.4%, a difference of 0.030%), Ukrainian (49.4%, a difference of 0.13%), Immigrants from Nepal (49.5%, a difference of 0.16%), Venezuelan (49.4%, a difference of 0.20%), and Croatian (49.3%, a difference of 0.34%).
| Demographics | Rating | Rank | Associate's Degree |
| Laotians | 98.4 /100 | #94 | Exceptional 49.9% |
| Immigrants | England | 98.0 /100 | #95 | Exceptional 49.7% |
| Romanians | 98.0 /100 | #96 | Exceptional 49.7% |
| Immigrants | Ukraine | 98.0 /100 | #97 | Exceptional 49.7% |
| Immigrants | Northern Africa | 97.9 /100 | #98 | Exceptional 49.7% |
| Macedonians | 97.8 /100 | #99 | Exceptional 49.6% |
| Immigrants | Nepal | 97.5 /100 | #100 | Exceptional 49.5% |
| Northern Europeans | 97.3 /100 | #101 | Exceptional 49.5% |
| Chileans | 97.3 /100 | #102 | Exceptional 49.4% |
| Ukrainians | 97.1 /100 | #103 | Exceptional 49.4% |
| Venezuelans | 97.0 /100 | #104 | Exceptional 49.4% |
| Croatians | 96.8 /100 | #105 | Exceptional 49.3% |
| Immigrants | Italy | 96.7 /100 | #106 | Exceptional 49.3% |
| Syrians | 96.7 /100 | #107 | Exceptional 49.3% |
| Jordanians | 96.6 /100 | #108 | Exceptional 49.2% |