Immigrants from Western Africa vs Immigrants from Sweden Associate's Degree
COMPARE
Immigrants from Western Africa
Immigrants from Sweden
Associate's Degree
Associate's Degree Comparison
Immigrants from Western Africa
Immigrants from Sweden
44.1%
ASSOCIATE'S DEGREE
6.6/ 100
METRIC RATING
221st/ 347
METRIC RANK
54.6%
ASSOCIATE'S DEGREE
100.0/ 100
METRIC RATING
21st/ 347
METRIC RANK
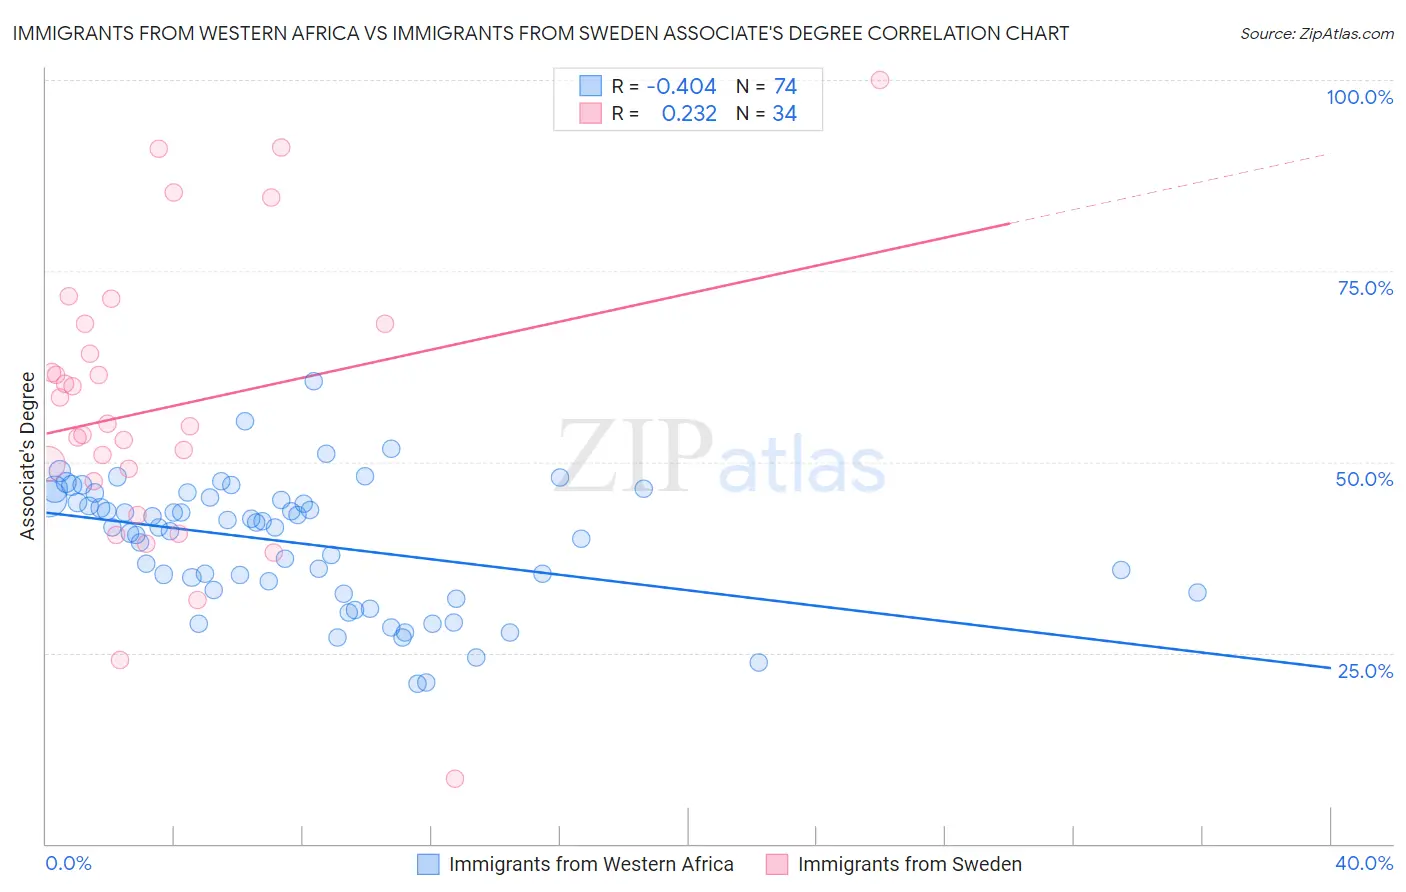
Immigrants from Western Africa vs Immigrants from Sweden Associate's Degree Correlation Chart
The statistical analysis conducted on geographies consisting of 357,851,677 people shows a moderate negative correlation between the proportion of Immigrants from Western Africa and percentage of population with at least associate's degree education in the United States with a correlation coefficient (R) of -0.404 and weighted average of 44.1%. Similarly, the statistical analysis conducted on geographies consisting of 164,727,727 people shows a weak positive correlation between the proportion of Immigrants from Sweden and percentage of population with at least associate's degree education in the United States with a correlation coefficient (R) of 0.232 and weighted average of 54.6%, a difference of 24.0%.
Associate's Degree Correlation Summary
| Measurement | Immigrants from Western Africa | Immigrants from Sweden |
| Minimum | 21.0% | 8.6% |
| Maximum | 60.6% | 100.0% |
| Range | 39.6% | 91.4% |
| Mean | 39.4% | 57.1% |
| Median | 41.4% | 54.8% |
| Interquartile 25% (IQ1) | 33.2% | 47.4% |
| Interquartile 75% (IQ3) | 45.1% | 68.1% |
| Interquartile Range (IQR) | 11.9% | 20.7% |
| Standard Deviation (Sample) | 8.2% | 19.3% |
| Standard Deviation (Population) | 8.1% | 19.0% |
Similar Demographics by Associate's Degree
Demographics Similar to Immigrants from Western Africa by Associate's Degree
In terms of associate's degree, the demographic groups most similar to Immigrants from Western Africa are Portuguese (44.1%, a difference of 0.20%), White/Caucasian (44.2%, a difference of 0.27%), Barbadian (43.9%, a difference of 0.27%), Subsaharan African (43.9%, a difference of 0.37%), and West Indian (43.8%, a difference of 0.51%).
| Demographics | Rating | Rank | Associate's Degree |
| Immigrants | Middle Africa | 12.7 /100 | #214 | Poor 44.7% |
| Immigrants | Panama | 12.4 /100 | #215 | Poor 44.7% |
| Immigrants | Nigeria | 11.4 /100 | #216 | Poor 44.6% |
| Immigrants | Immigrants | 10.5 /100 | #217 | Poor 44.5% |
| Spanish | 9.4 /100 | #218 | Tragic 44.4% |
| Whites/Caucasians | 7.5 /100 | #219 | Tragic 44.2% |
| Portuguese | 7.2 /100 | #220 | Tragic 44.1% |
| Immigrants | Western Africa | 6.6 /100 | #221 | Tragic 44.1% |
| Barbadians | 5.8 /100 | #222 | Tragic 43.9% |
| Sub-Saharan Africans | 5.5 /100 | #223 | Tragic 43.9% |
| West Indians | 5.2 /100 | #224 | Tragic 43.8% |
| Guamanians/Chamorros | 4.8 /100 | #225 | Tragic 43.8% |
| Immigrants | Burma/Myanmar | 4.3 /100 | #226 | Tragic 43.7% |
| Trinidadians and Tobagonians | 4.0 /100 | #227 | Tragic 43.6% |
| Hmong | 3.2 /100 | #228 | Tragic 43.4% |
Demographics Similar to Immigrants from Sweden by Associate's Degree
In terms of associate's degree, the demographic groups most similar to Immigrants from Sweden are Immigrants from Japan (54.6%, a difference of 0.030%), Burmese (54.6%, a difference of 0.030%), Cambodian (54.6%, a difference of 0.060%), Immigrants from Ireland (54.7%, a difference of 0.090%), and Immigrants from Korea (54.5%, a difference of 0.12%).
| Demographics | Rating | Rank | Associate's Degree |
| Immigrants | Hong Kong | 100.0 /100 | #14 | Exceptional 55.4% |
| Immigrants | Eastern Asia | 100.0 /100 | #15 | Exceptional 55.4% |
| Soviet Union | 100.0 /100 | #16 | Exceptional 55.1% |
| Eastern Europeans | 100.0 /100 | #17 | Exceptional 55.0% |
| Indians (Asian) | 100.0 /100 | #18 | Exceptional 54.8% |
| Immigrants | Ireland | 100.0 /100 | #19 | Exceptional 54.7% |
| Cambodians | 100.0 /100 | #20 | Exceptional 54.6% |
| Immigrants | Sweden | 100.0 /100 | #21 | Exceptional 54.6% |
| Immigrants | Japan | 100.0 /100 | #22 | Exceptional 54.6% |
| Burmese | 100.0 /100 | #23 | Exceptional 54.6% |
| Immigrants | Korea | 100.0 /100 | #24 | Exceptional 54.5% |
| Immigrants | Switzerland | 100.0 /100 | #25 | Exceptional 54.5% |
| Immigrants | Belgium | 100.0 /100 | #26 | Exceptional 54.5% |
| Latvians | 100.0 /100 | #27 | Exceptional 53.9% |
| Turks | 100.0 /100 | #28 | Exceptional 53.9% |