Immigrants from Western Africa vs Yup'ik Associate's Degree
COMPARE
Immigrants from Western Africa
Yup'ik
Associate's Degree
Associate's Degree Comparison
Immigrants from Western Africa
Yup'ik
44.1%
ASSOCIATE'S DEGREE
6.6/ 100
METRIC RATING
221st/ 347
METRIC RANK
25.0%
ASSOCIATE'S DEGREE
0.0/ 100
METRIC RATING
347th/ 347
METRIC RANK
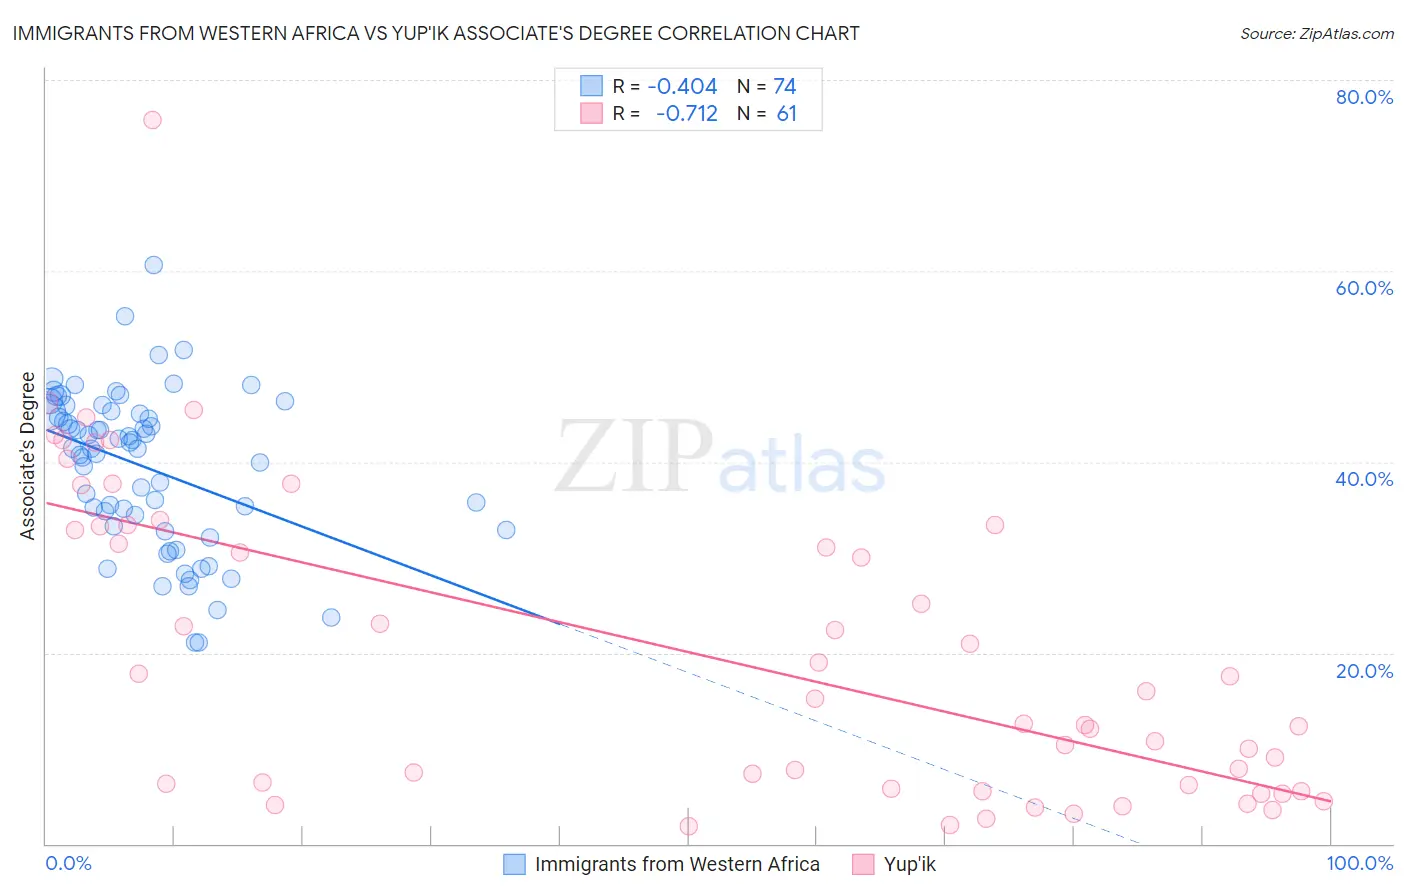
Immigrants from Western Africa vs Yup'ik Associate's Degree Correlation Chart
The statistical analysis conducted on geographies consisting of 357,851,677 people shows a moderate negative correlation between the proportion of Immigrants from Western Africa and percentage of population with at least associate's degree education in the United States with a correlation coefficient (R) of -0.404 and weighted average of 44.1%. Similarly, the statistical analysis conducted on geographies consisting of 39,962,242 people shows a strong negative correlation between the proportion of Yup'ik and percentage of population with at least associate's degree education in the United States with a correlation coefficient (R) of -0.712 and weighted average of 25.0%, a difference of 76.5%.
Associate's Degree Correlation Summary
| Measurement | Immigrants from Western Africa | Yup'ik |
| Minimum | 21.0% | 1.8% |
| Maximum | 60.6% | 75.8% |
| Range | 39.6% | 74.0% |
| Mean | 39.4% | 20.1% |
| Median | 41.4% | 15.2% |
| Interquartile 25% (IQ1) | 33.2% | 5.9% |
| Interquartile 75% (IQ3) | 45.1% | 33.3% |
| Interquartile Range (IQR) | 11.9% | 27.4% |
| Standard Deviation (Sample) | 8.2% | 16.1% |
| Standard Deviation (Population) | 8.1% | 16.0% |
Similar Demographics by Associate's Degree
Demographics Similar to Immigrants from Western Africa by Associate's Degree
In terms of associate's degree, the demographic groups most similar to Immigrants from Western Africa are Portuguese (44.1%, a difference of 0.20%), White/Caucasian (44.2%, a difference of 0.27%), Barbadian (43.9%, a difference of 0.27%), Subsaharan African (43.9%, a difference of 0.37%), and West Indian (43.8%, a difference of 0.51%).
| Demographics | Rating | Rank | Associate's Degree |
| Immigrants | Middle Africa | 12.7 /100 | #214 | Poor 44.7% |
| Immigrants | Panama | 12.4 /100 | #215 | Poor 44.7% |
| Immigrants | Nigeria | 11.4 /100 | #216 | Poor 44.6% |
| Immigrants | Immigrants | 10.5 /100 | #217 | Poor 44.5% |
| Spanish | 9.4 /100 | #218 | Tragic 44.4% |
| Whites/Caucasians | 7.5 /100 | #219 | Tragic 44.2% |
| Portuguese | 7.2 /100 | #220 | Tragic 44.1% |
| Immigrants | Western Africa | 6.6 /100 | #221 | Tragic 44.1% |
| Barbadians | 5.8 /100 | #222 | Tragic 43.9% |
| Sub-Saharan Africans | 5.5 /100 | #223 | Tragic 43.9% |
| West Indians | 5.2 /100 | #224 | Tragic 43.8% |
| Guamanians/Chamorros | 4.8 /100 | #225 | Tragic 43.8% |
| Immigrants | Burma/Myanmar | 4.3 /100 | #226 | Tragic 43.7% |
| Trinidadians and Tobagonians | 4.0 /100 | #227 | Tragic 43.6% |
| Hmong | 3.2 /100 | #228 | Tragic 43.4% |
Demographics Similar to Yup'ik by Associate's Degree
In terms of associate's degree, the demographic groups most similar to Yup'ik are Houma (28.2%, a difference of 13.0%), Pima (30.2%, a difference of 21.1%), Yuman (31.3%, a difference of 25.2%), Tohono O'odham (31.8%, a difference of 27.3%), and Yakama (32.3%, a difference of 29.5%).
| Demographics | Rating | Rank | Associate's Degree |
| Mexicans | 0.0 /100 | #333 | Tragic 35.0% |
| Natives/Alaskans | 0.0 /100 | #334 | Tragic 34.9% |
| Spanish American Indians | 0.0 /100 | #335 | Tragic 34.9% |
| Hopi | 0.0 /100 | #336 | Tragic 34.6% |
| Lumbee | 0.0 /100 | #337 | Tragic 34.1% |
| Pueblo | 0.0 /100 | #338 | Tragic 34.0% |
| Immigrants | Mexico | 0.0 /100 | #339 | Tragic 33.7% |
| Navajo | 0.0 /100 | #340 | Tragic 32.6% |
| Inupiat | 0.0 /100 | #341 | Tragic 32.6% |
| Yakama | 0.0 /100 | #342 | Tragic 32.3% |
| Tohono O'odham | 0.0 /100 | #343 | Tragic 31.8% |
| Yuman | 0.0 /100 | #344 | Tragic 31.3% |
| Pima | 0.0 /100 | #345 | Tragic 30.2% |
| Houma | 0.0 /100 | #346 | Tragic 28.2% |
| Yup'ik | 0.0 /100 | #347 | Tragic 25.0% |