Immigrants from West Indies vs Yakama Doctorate Degree
COMPARE
Immigrants from West Indies
Yakama
Doctorate Degree
Doctorate Degree Comparison
Immigrants from West Indies
Yakama
1.5%
DOCTORATE DEGREE
0.9/ 100
METRIC RATING
258th/ 347
METRIC RANK
1.3%
DOCTORATE DEGREE
0.0/ 100
METRIC RATING
332nd/ 347
METRIC RANK
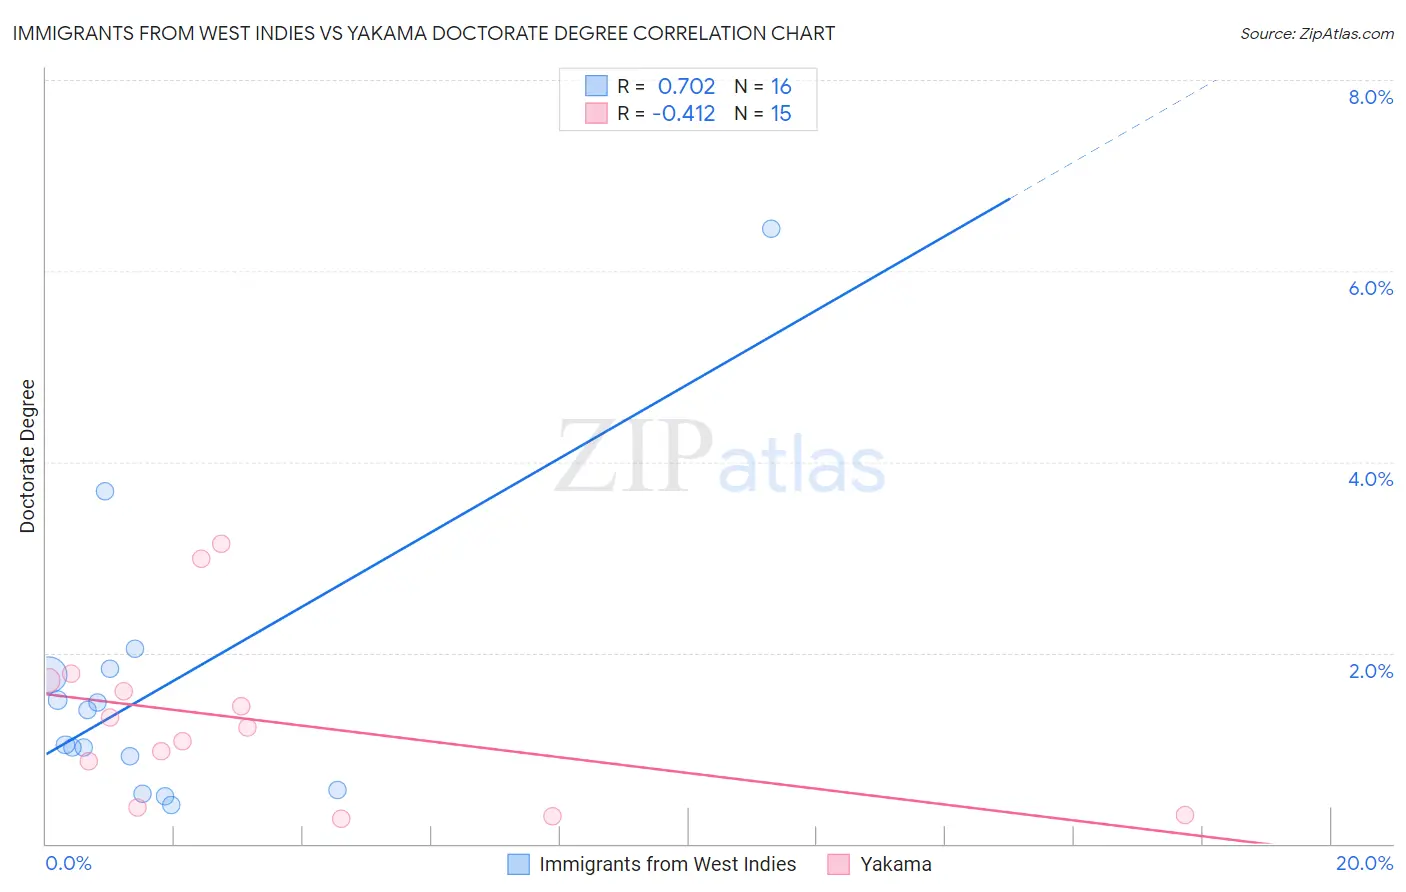
Immigrants from West Indies vs Yakama Doctorate Degree Correlation Chart
The statistical analysis conducted on geographies consisting of 72,397,749 people shows a strong positive correlation between the proportion of Immigrants from West Indies and percentage of population with at least doctorate degree education in the United States with a correlation coefficient (R) of 0.702 and weighted average of 1.5%. Similarly, the statistical analysis conducted on geographies consisting of 19,742,770 people shows a moderate negative correlation between the proportion of Yakama and percentage of population with at least doctorate degree education in the United States with a correlation coefficient (R) of -0.412 and weighted average of 1.3%, a difference of 18.5%.
Doctorate Degree Correlation Summary
| Measurement | Immigrants from West Indies | Yakama |
| Minimum | 0.40% | 0.27% |
| Maximum | 6.4% | 3.1% |
| Range | 6.0% | 2.9% |
| Mean | 1.6% | 1.3% |
| Median | 1.2% | 1.2% |
| Interquartile 25% (IQ1) | 0.74% | 0.37% |
| Interquartile 75% (IQ3) | 1.8% | 1.7% |
| Interquartile Range (IQR) | 1.1% | 1.3% |
| Standard Deviation (Sample) | 1.5% | 0.89% |
| Standard Deviation (Population) | 1.5% | 0.86% |
Similar Demographics by Doctorate Degree
Demographics Similar to Immigrants from West Indies by Doctorate Degree
In terms of doctorate degree, the demographic groups most similar to Immigrants from West Indies are Liberian (1.5%, a difference of 0.030%), Japanese (1.5%, a difference of 0.12%), Chippewa (1.5%, a difference of 0.26%), Central American Indian (1.5%, a difference of 0.48%), and Immigrants from Cambodia (1.5%, a difference of 0.53%).
| Demographics | Rating | Rank | Doctorate Degree |
| Apache | 1.3 /100 | #251 | Tragic 1.5% |
| Yuman | 1.1 /100 | #252 | Tragic 1.5% |
| Americans | 1.0 /100 | #253 | Tragic 1.5% |
| Immigrants | Cambodia | 1.0 /100 | #254 | Tragic 1.5% |
| Trinidadians and Tobagonians | 1.0 /100 | #255 | Tragic 1.5% |
| Central American Indians | 1.0 /100 | #256 | Tragic 1.5% |
| Chippewa | 0.9 /100 | #257 | Tragic 1.5% |
| Immigrants | West Indies | 0.9 /100 | #258 | Tragic 1.5% |
| Liberians | 0.9 /100 | #259 | Tragic 1.5% |
| Japanese | 0.9 /100 | #260 | Tragic 1.5% |
| Immigrants | Portugal | 0.8 /100 | #261 | Tragic 1.5% |
| Chickasaw | 0.7 /100 | #262 | Tragic 1.5% |
| Immigrants | Bahamas | 0.7 /100 | #263 | Tragic 1.5% |
| Blackfeet | 0.7 /100 | #264 | Tragic 1.5% |
| Nicaraguans | 0.6 /100 | #265 | Tragic 1.5% |
Demographics Similar to Yakama by Doctorate Degree
In terms of doctorate degree, the demographic groups most similar to Yakama are Immigrants from Caribbean (1.3%, a difference of 0.16%), Immigrants from Dominican Republic (1.3%, a difference of 0.35%), Immigrants from Latin America (1.3%, a difference of 1.6%), Yup'ik (1.3%, a difference of 1.6%), and Haitian (1.3%, a difference of 1.8%).
| Demographics | Rating | Rank | Doctorate Degree |
| Pima | 0.0 /100 | #325 | Tragic 1.3% |
| Immigrants | Cabo Verde | 0.0 /100 | #326 | Tragic 1.3% |
| Hispanics or Latinos | 0.0 /100 | #327 | Tragic 1.3% |
| Inupiat | 0.0 /100 | #328 | Tragic 1.3% |
| Haitians | 0.0 /100 | #329 | Tragic 1.3% |
| Yup'ik | 0.0 /100 | #330 | Tragic 1.3% |
| Immigrants | Latin America | 0.0 /100 | #331 | Tragic 1.3% |
| Yakama | 0.0 /100 | #332 | Tragic 1.3% |
| Immigrants | Caribbean | 0.0 /100 | #333 | Tragic 1.3% |
| Immigrants | Dominican Republic | 0.0 /100 | #334 | Tragic 1.3% |
| Immigrants | Haiti | 0.0 /100 | #335 | Tragic 1.3% |
| Nepalese | 0.0 /100 | #336 | Tragic 1.3% |
| Bangladeshis | 0.0 /100 | #337 | Tragic 1.2% |
| Puget Sound Salish | 0.0 /100 | #338 | Tragic 1.2% |
| Immigrants | Central America | 0.0 /100 | #339 | Tragic 1.2% |