Immigrants from West Indies vs Immigrants from Brazil Doctorate Degree
COMPARE
Immigrants from West Indies
Immigrants from Brazil
Doctorate Degree
Doctorate Degree Comparison
Immigrants from West Indies
Immigrants from Brazil
1.5%
DOCTORATE DEGREE
0.9/ 100
METRIC RATING
258th/ 347
METRIC RANK
2.2%
DOCTORATE DEGREE
99.6/ 100
METRIC RATING
85th/ 347
METRIC RANK
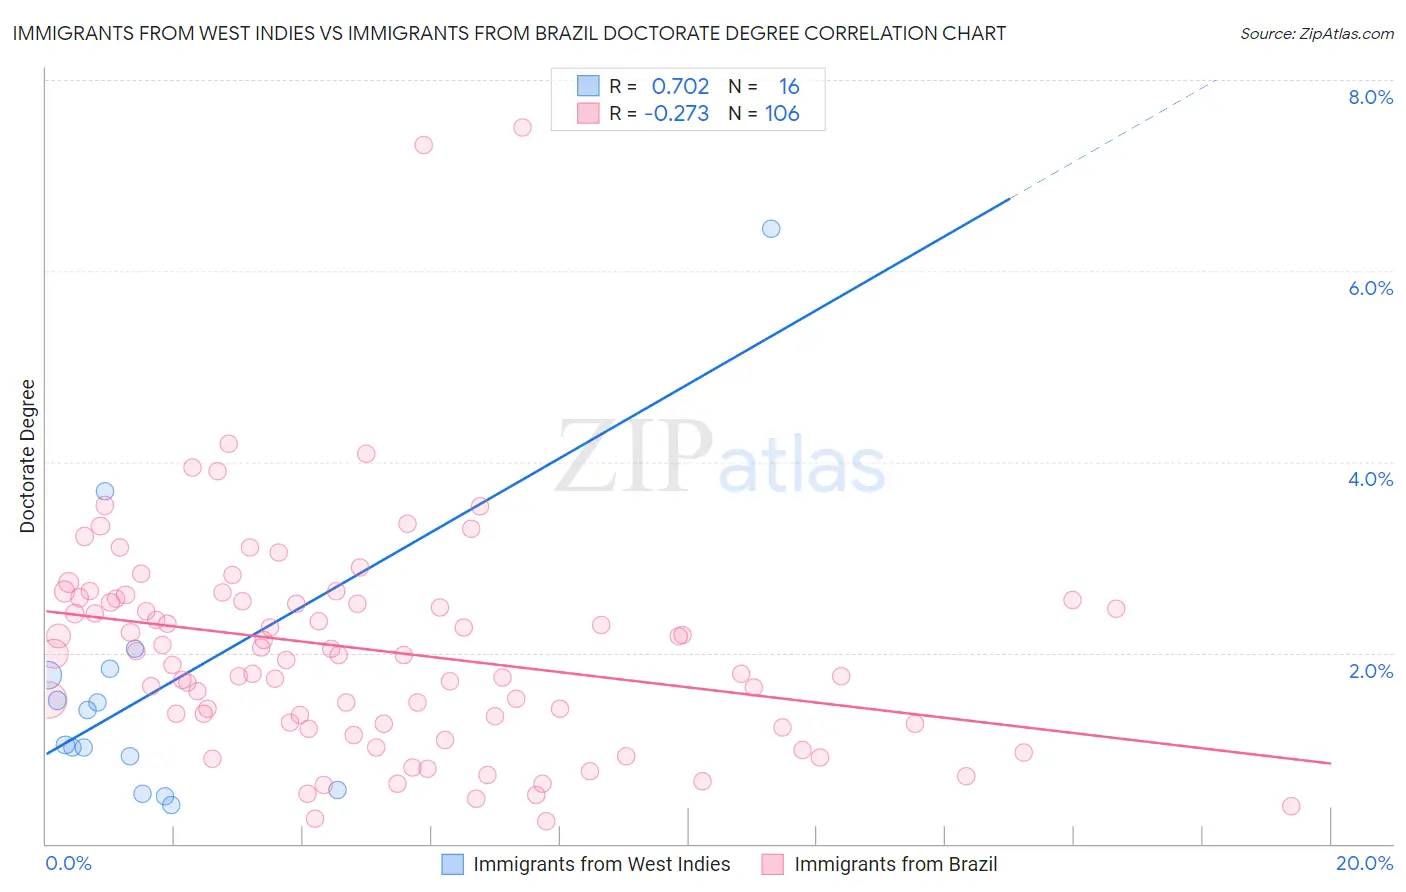
Immigrants from West Indies vs Immigrants from Brazil Doctorate Degree Correlation Chart
The statistical analysis conducted on geographies consisting of 72,397,749 people shows a strong positive correlation between the proportion of Immigrants from West Indies and percentage of population with at least doctorate degree education in the United States with a correlation coefficient (R) of 0.702 and weighted average of 1.5%. Similarly, the statistical analysis conducted on geographies consisting of 341,357,062 people shows a weak negative correlation between the proportion of Immigrants from Brazil and percentage of population with at least doctorate degree education in the United States with a correlation coefficient (R) of -0.273 and weighted average of 2.2%, a difference of 44.9%.
Doctorate Degree Correlation Summary
| Measurement | Immigrants from West Indies | Immigrants from Brazil |
| Minimum | 0.40% | 0.24% |
| Maximum | 6.4% | 7.5% |
| Range | 6.0% | 7.3% |
| Mean | 1.6% | 2.0% |
| Median | 1.2% | 2.0% |
| Interquartile 25% (IQ1) | 0.74% | 1.3% |
| Interquartile 75% (IQ3) | 1.8% | 2.6% |
| Interquartile Range (IQR) | 1.1% | 1.3% |
| Standard Deviation (Sample) | 1.5% | 1.2% |
| Standard Deviation (Population) | 1.5% | 1.2% |
Similar Demographics by Doctorate Degree
Demographics Similar to Immigrants from West Indies by Doctorate Degree
In terms of doctorate degree, the demographic groups most similar to Immigrants from West Indies are Liberian (1.5%, a difference of 0.030%), Japanese (1.5%, a difference of 0.12%), Chippewa (1.5%, a difference of 0.26%), Central American Indian (1.5%, a difference of 0.48%), and Immigrants from Cambodia (1.5%, a difference of 0.53%).
| Demographics | Rating | Rank | Doctorate Degree |
| Apache | 1.3 /100 | #251 | Tragic 1.5% |
| Yuman | 1.1 /100 | #252 | Tragic 1.5% |
| Americans | 1.0 /100 | #253 | Tragic 1.5% |
| Immigrants | Cambodia | 1.0 /100 | #254 | Tragic 1.5% |
| Trinidadians and Tobagonians | 1.0 /100 | #255 | Tragic 1.5% |
| Central American Indians | 1.0 /100 | #256 | Tragic 1.5% |
| Chippewa | 0.9 /100 | #257 | Tragic 1.5% |
| Immigrants | West Indies | 0.9 /100 | #258 | Tragic 1.5% |
| Liberians | 0.9 /100 | #259 | Tragic 1.5% |
| Japanese | 0.9 /100 | #260 | Tragic 1.5% |
| Immigrants | Portugal | 0.8 /100 | #261 | Tragic 1.5% |
| Chickasaw | 0.7 /100 | #262 | Tragic 1.5% |
| Immigrants | Bahamas | 0.7 /100 | #263 | Tragic 1.5% |
| Blackfeet | 0.7 /100 | #264 | Tragic 1.5% |
| Nicaraguans | 0.6 /100 | #265 | Tragic 1.5% |
Demographics Similar to Immigrants from Brazil by Doctorate Degree
In terms of doctorate degree, the demographic groups most similar to Immigrants from Brazil are Immigrants from England (2.2%, a difference of 0.13%), Immigrants from Lithuania (2.2%, a difference of 0.27%), Immigrants from Uganda (2.2%, a difference of 0.45%), Egyptian (2.2%, a difference of 0.70%), and Immigrants from Zimbabwe (2.2%, a difference of 0.81%).
| Demographics | Rating | Rank | Doctorate Degree |
| Immigrants | Belarus | 99.7 /100 | #78 | Exceptional 2.2% |
| Northern Europeans | 99.7 /100 | #79 | Exceptional 2.2% |
| Ugandans | 99.7 /100 | #80 | Exceptional 2.2% |
| Immigrants | Argentina | 99.7 /100 | #81 | Exceptional 2.2% |
| Immigrants | Uganda | 99.6 /100 | #82 | Exceptional 2.2% |
| Immigrants | Lithuania | 99.6 /100 | #83 | Exceptional 2.2% |
| Immigrants | England | 99.6 /100 | #84 | Exceptional 2.2% |
| Immigrants | Brazil | 99.6 /100 | #85 | Exceptional 2.2% |
| Egyptians | 99.4 /100 | #86 | Exceptional 2.2% |
| Immigrants | Zimbabwe | 99.4 /100 | #87 | Exceptional 2.2% |
| Immigrants | Nepal | 99.3 /100 | #88 | Exceptional 2.2% |
| British | 99.3 /100 | #89 | Exceptional 2.2% |
| Immigrants | Scotland | 99.2 /100 | #90 | Exceptional 2.2% |
| Immigrants | Sudan | 99.1 /100 | #91 | Exceptional 2.2% |
| Chileans | 99.1 /100 | #92 | Exceptional 2.2% |