Immigrants from West Indies vs Paiute Doctorate Degree
COMPARE
Immigrants from West Indies
Paiute
Doctorate Degree
Doctorate Degree Comparison
Immigrants from West Indies
Paiute
1.5%
DOCTORATE DEGREE
0.9/ 100
METRIC RATING
258th/ 347
METRIC RANK
1.5%
DOCTORATE DEGREE
0.4/ 100
METRIC RATING
276th/ 347
METRIC RANK
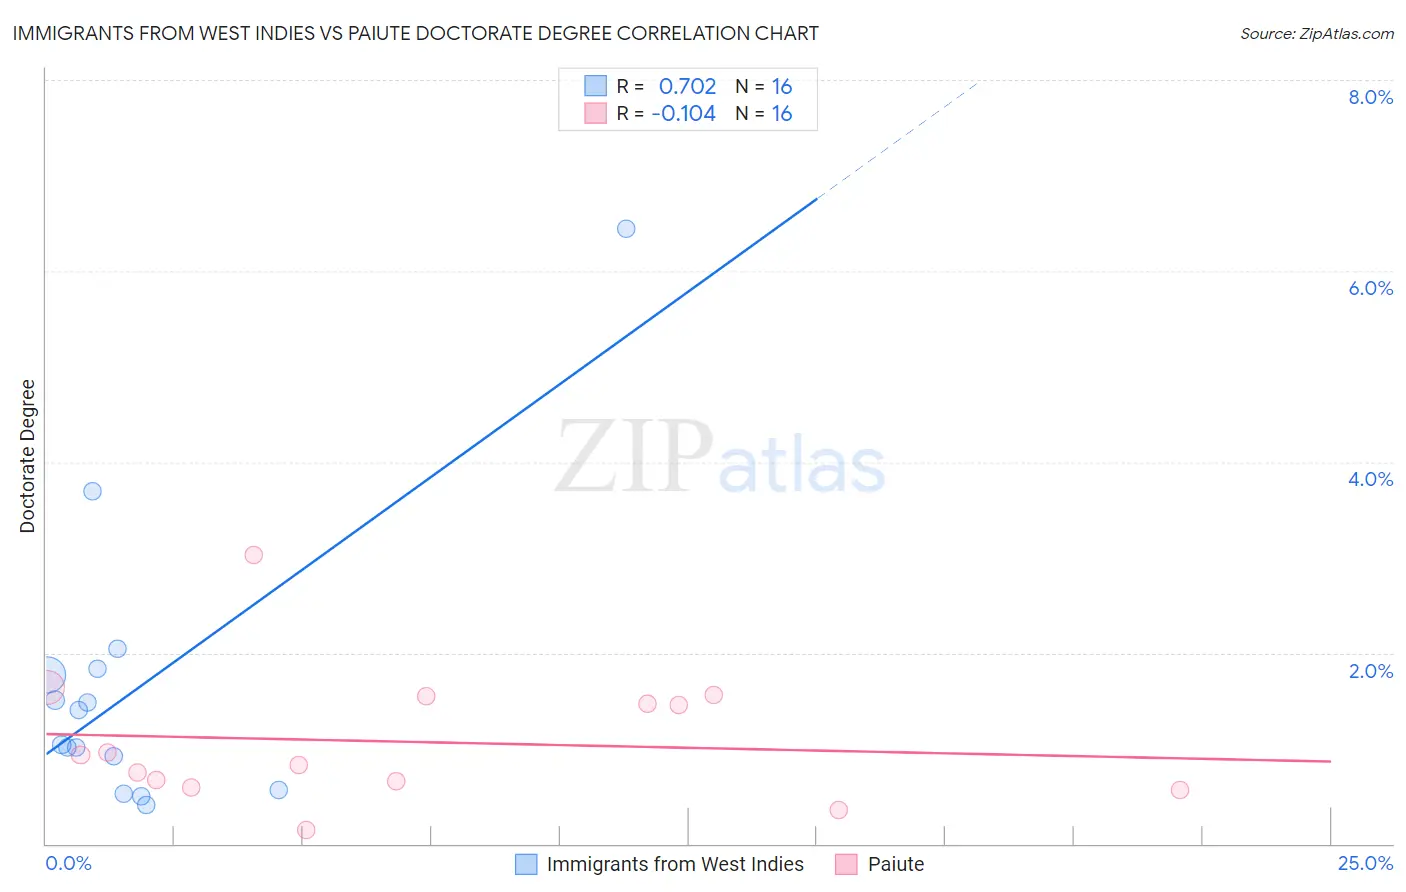
Immigrants from West Indies vs Paiute Doctorate Degree Correlation Chart
The statistical analysis conducted on geographies consisting of 72,397,749 people shows a strong positive correlation between the proportion of Immigrants from West Indies and percentage of population with at least doctorate degree education in the United States with a correlation coefficient (R) of 0.702 and weighted average of 1.5%. Similarly, the statistical analysis conducted on geographies consisting of 58,124,272 people shows a poor negative correlation between the proportion of Paiute and percentage of population with at least doctorate degree education in the United States with a correlation coefficient (R) of -0.104 and weighted average of 1.5%, a difference of 3.4%.
Doctorate Degree Correlation Summary
| Measurement | Immigrants from West Indies | Paiute |
| Minimum | 0.40% | 0.15% |
| Maximum | 6.4% | 3.0% |
| Range | 6.0% | 2.9% |
| Mean | 1.6% | 1.1% |
| Median | 1.2% | 0.88% |
| Interquartile 25% (IQ1) | 0.74% | 0.62% |
| Interquartile 75% (IQ3) | 1.8% | 1.5% |
| Interquartile Range (IQR) | 1.1% | 0.88% |
| Standard Deviation (Sample) | 1.5% | 0.70% |
| Standard Deviation (Population) | 1.5% | 0.67% |
Demographics Similar to Immigrants from West Indies and Paiute by Doctorate Degree
In terms of doctorate degree, the demographic groups most similar to Immigrants from West Indies are Liberian (1.5%, a difference of 0.030%), Japanese (1.5%, a difference of 0.12%), Chippewa (1.5%, a difference of 0.26%), Immigrants from Portugal (1.5%, a difference of 0.59%), and Chickasaw (1.5%, a difference of 0.74%). Similarly, the demographic groups most similar to Paiute are Aleut (1.5%, a difference of 0.050%), Yaqui (1.5%, a difference of 0.17%), Sioux (1.5%, a difference of 0.19%), Immigrants from Barbados (1.5%, a difference of 0.30%), and Immigrants from Trinidad and Tobago (1.5%, a difference of 0.39%).
| Demographics | Rating | Rank | Doctorate Degree |
| Chippewa | 0.9 /100 | #257 | Tragic 1.5% |
| Immigrants | West Indies | 0.9 /100 | #258 | Tragic 1.5% |
| Liberians | 0.9 /100 | #259 | Tragic 1.5% |
| Japanese | 0.9 /100 | #260 | Tragic 1.5% |
| Immigrants | Portugal | 0.8 /100 | #261 | Tragic 1.5% |
| Chickasaw | 0.7 /100 | #262 | Tragic 1.5% |
| Immigrants | Bahamas | 0.7 /100 | #263 | Tragic 1.5% |
| Blackfeet | 0.7 /100 | #264 | Tragic 1.5% |
| Nicaraguans | 0.6 /100 | #265 | Tragic 1.5% |
| Immigrants | Liberia | 0.5 /100 | #266 | Tragic 1.5% |
| Kiowa | 0.5 /100 | #267 | Tragic 1.5% |
| U.S. Virgin Islanders | 0.5 /100 | #268 | Tragic 1.5% |
| Crow | 0.5 /100 | #269 | Tragic 1.5% |
| Salvadorans | 0.5 /100 | #270 | Tragic 1.5% |
| Immigrants | Trinidad and Tobago | 0.5 /100 | #271 | Tragic 1.5% |
| Immigrants | Barbados | 0.4 /100 | #272 | Tragic 1.5% |
| Sioux | 0.4 /100 | #273 | Tragic 1.5% |
| Yaqui | 0.4 /100 | #274 | Tragic 1.5% |
| Aleuts | 0.4 /100 | #275 | Tragic 1.5% |
| Paiute | 0.4 /100 | #276 | Tragic 1.5% |
| Bahamians | 0.4 /100 | #277 | Tragic 1.5% |