Immigrants from Vietnam vs Native/Alaskan GED/Equivalency
COMPARE
Immigrants from Vietnam
Native/Alaskan
GED/Equivalency
GED/Equivalency Comparison
Immigrants from Vietnam
Natives/Alaskans
83.2%
GED/EQUIVALENCY
0.3/ 100
METRIC RATING
259th/ 347
METRIC RANK
80.9%
GED/EQUIVALENCY
0.0/ 100
METRIC RATING
311th/ 347
METRIC RANK
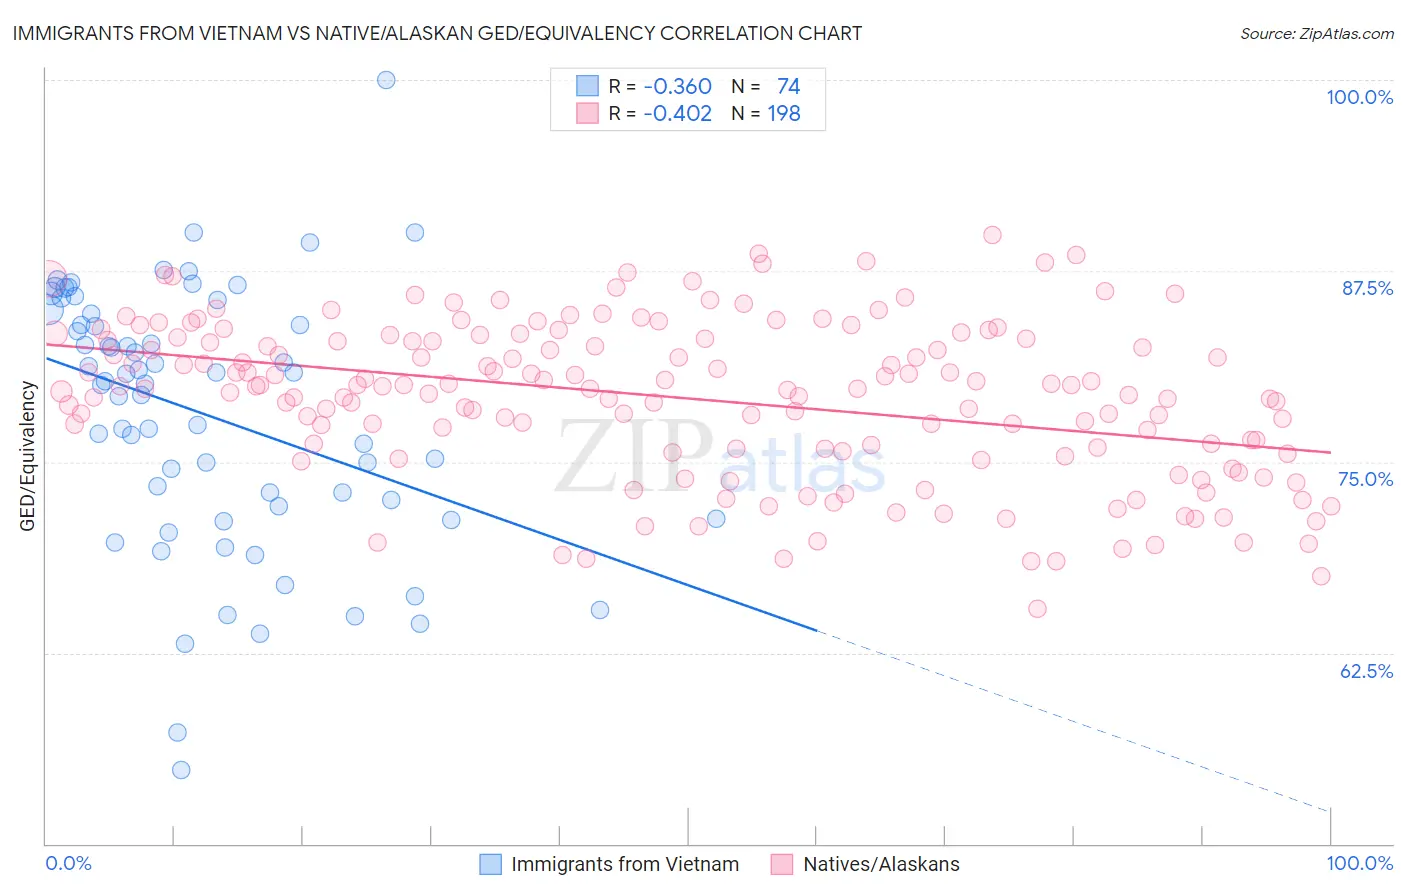
Immigrants from Vietnam vs Native/Alaskan GED/Equivalency Correlation Chart
The statistical analysis conducted on geographies consisting of 404,843,872 people shows a mild negative correlation between the proportion of Immigrants from Vietnam and percentage of population with at least ged/equivalency education in the United States with a correlation coefficient (R) of -0.360 and weighted average of 83.2%. Similarly, the statistical analysis conducted on geographies consisting of 513,073,690 people shows a moderate negative correlation between the proportion of Natives/Alaskans and percentage of population with at least ged/equivalency education in the United States with a correlation coefficient (R) of -0.402 and weighted average of 80.9%, a difference of 2.7%.
GED/Equivalency Correlation Summary
| Measurement | Immigrants from Vietnam | Native/Alaskan |
| Minimum | 54.8% | 65.4% |
| Maximum | 100.0% | 89.9% |
| Range | 45.2% | 24.5% |
| Mean | 78.1% | 79.2% |
| Median | 80.2% | 79.9% |
| Interquartile 25% (IQ1) | 72.1% | 75.8% |
| Interquartile 75% (IQ3) | 84.7% | 83.0% |
| Interquartile Range (IQR) | 12.6% | 7.2% |
| Standard Deviation (Sample) | 8.5% | 5.1% |
| Standard Deviation (Population) | 8.5% | 5.1% |
Similar Demographics by GED/Equivalency
Demographics Similar to Immigrants from Vietnam by GED/Equivalency
In terms of ged/equivalency, the demographic groups most similar to Immigrants from Vietnam are Choctaw (83.1%, a difference of 0.030%), Inupiat (83.1%, a difference of 0.090%), Immigrants from Armenia (83.1%, a difference of 0.090%), Immigrants from Congo (83.1%, a difference of 0.10%), and Bangladeshi (83.1%, a difference of 0.11%).
| Demographics | Rating | Rank | GED/Equivalency |
| Bahamians | 0.8 /100 | #252 | Tragic 83.6% |
| Comanche | 0.7 /100 | #253 | Tragic 83.6% |
| Creek | 0.7 /100 | #254 | Tragic 83.6% |
| Colville | 0.5 /100 | #255 | Tragic 83.4% |
| Africans | 0.5 /100 | #256 | Tragic 83.4% |
| Jamaicans | 0.4 /100 | #257 | Tragic 83.3% |
| Malaysians | 0.4 /100 | #258 | Tragic 83.3% |
| Immigrants | Vietnam | 0.3 /100 | #259 | Tragic 83.2% |
| Choctaw | 0.3 /100 | #260 | Tragic 83.1% |
| Inupiat | 0.2 /100 | #261 | Tragic 83.1% |
| Immigrants | Armenia | 0.2 /100 | #262 | Tragic 83.1% |
| Immigrants | Congo | 0.2 /100 | #263 | Tragic 83.1% |
| Bangladeshis | 0.2 /100 | #264 | Tragic 83.1% |
| West Indians | 0.2 /100 | #265 | Tragic 83.1% |
| Kiowa | 0.2 /100 | #266 | Tragic 83.1% |
Demographics Similar to Natives/Alaskans by GED/Equivalency
In terms of ged/equivalency, the demographic groups most similar to Natives/Alaskans are Immigrants from Guyana (81.0%, a difference of 0.0%), Nicaraguan (80.9%, a difference of 0.040%), Cape Verdean (80.9%, a difference of 0.040%), Belizean (80.9%, a difference of 0.060%), and Immigrants from Ecuador (81.0%, a difference of 0.070%).
| Demographics | Rating | Rank | GED/Equivalency |
| Navajo | 0.0 /100 | #304 | Tragic 81.5% |
| Immigrants | Grenada | 0.0 /100 | #305 | Tragic 81.3% |
| Guyanese | 0.0 /100 | #306 | Tragic 81.3% |
| Immigrants | Dominica | 0.0 /100 | #307 | Tragic 81.1% |
| Puerto Ricans | 0.0 /100 | #308 | Tragic 81.1% |
| Immigrants | Ecuador | 0.0 /100 | #309 | Tragic 81.0% |
| Immigrants | Guyana | 0.0 /100 | #310 | Tragic 81.0% |
| Natives/Alaskans | 0.0 /100 | #311 | Tragic 80.9% |
| Nicaraguans | 0.0 /100 | #312 | Tragic 80.9% |
| Cape Verdeans | 0.0 /100 | #313 | Tragic 80.9% |
| Belizeans | 0.0 /100 | #314 | Tragic 80.9% |
| Apache | 0.0 /100 | #315 | Tragic 80.7% |
| Central American Indians | 0.0 /100 | #316 | Tragic 80.6% |
| Immigrants | Caribbean | 0.0 /100 | #317 | Tragic 80.5% |
| Yaqui | 0.0 /100 | #318 | Tragic 80.5% |