Immigrants from Lebanon vs Nigerian College, Under 1 year
COMPARE
Immigrants from Lebanon
Nigerian
College, Under 1 year
College, Under 1 year Comparison
Immigrants from Lebanon
Nigerians
68.3%
COLLEGE, UNDER 1 YEAR
98.3/ 100
METRIC RATING
86th/ 347
METRIC RANK
64.3%
COLLEGE, UNDER 1 YEAR
16.7/ 100
METRIC RATING
200th/ 347
METRIC RANK
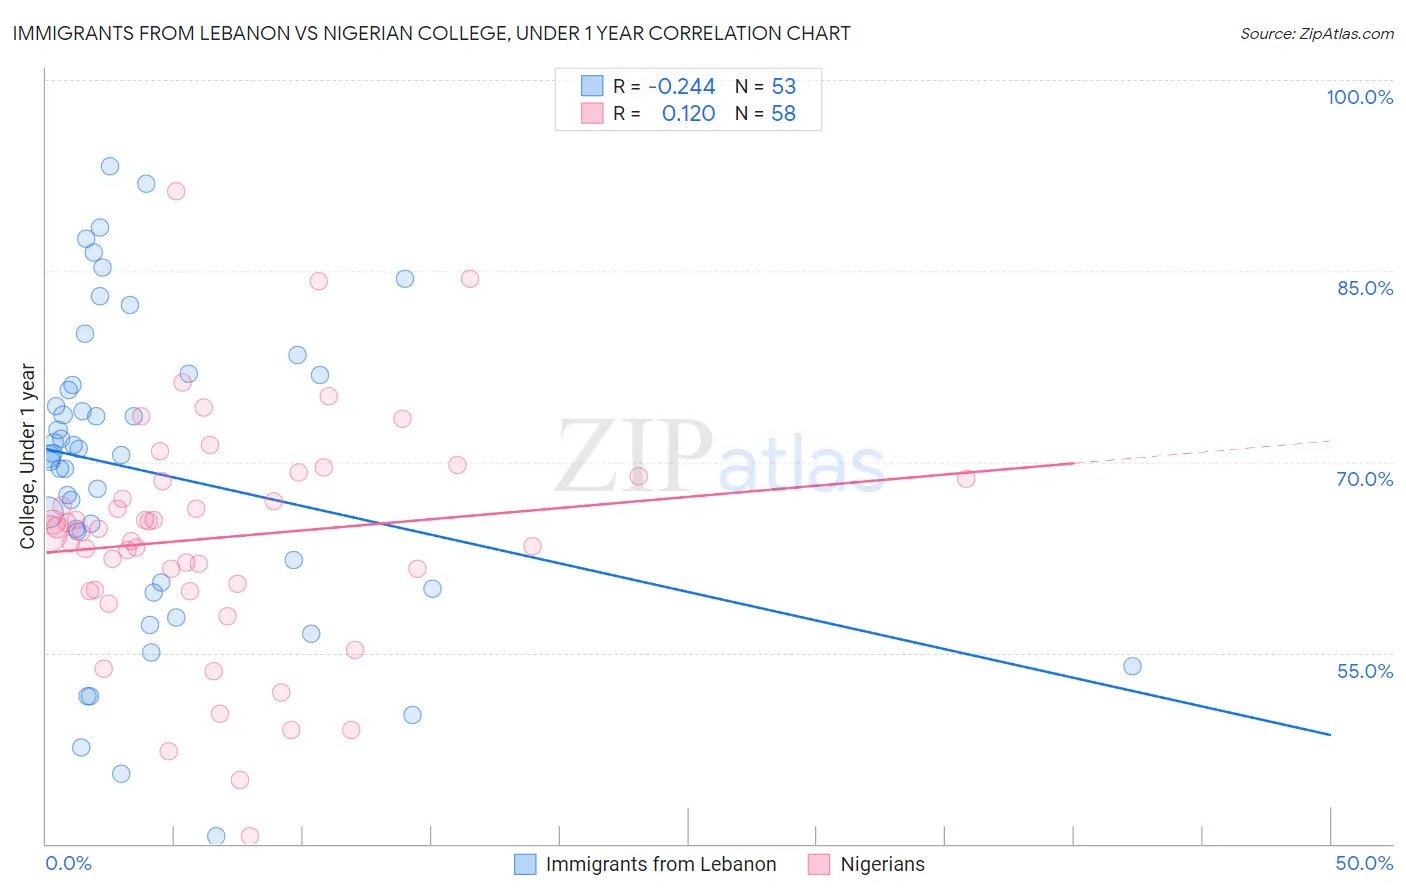
Immigrants from Lebanon vs Nigerian College, Under 1 year Correlation Chart
The statistical analysis conducted on geographies consisting of 217,164,247 people shows a weak negative correlation between the proportion of Immigrants from Lebanon and percentage of population with at least college, under 1 year education in the United States with a correlation coefficient (R) of -0.244 and weighted average of 68.3%. Similarly, the statistical analysis conducted on geographies consisting of 332,779,766 people shows a poor positive correlation between the proportion of Nigerians and percentage of population with at least college, under 1 year education in the United States with a correlation coefficient (R) of 0.120 and weighted average of 64.3%, a difference of 6.4%.
College, Under 1 year Correlation Summary
| Measurement | Immigrants from Lebanon | Nigerian |
| Minimum | 40.6% | 40.6% |
| Maximum | 93.2% | 91.3% |
| Range | 52.6% | 50.7% |
| Mean | 69.2% | 64.0% |
| Median | 70.6% | 64.6% |
| Interquartile 25% (IQ1) | 60.3% | 59.9% |
| Interquartile 75% (IQ3) | 76.5% | 68.7% |
| Interquartile Range (IQR) | 16.1% | 8.8% |
| Standard Deviation (Sample) | 12.1% | 9.2% |
| Standard Deviation (Population) | 12.0% | 9.2% |
Similar Demographics by College, Under 1 year
Demographics Similar to Immigrants from Lebanon by College, Under 1 year
In terms of college, under 1 year, the demographic groups most similar to Immigrants from Lebanon are Egyptian (68.3%, a difference of 0.0%), Immigrants from Hungary (68.3%, a difference of 0.010%), Chinese (68.3%, a difference of 0.020%), Argentinean (68.4%, a difference of 0.030%), and Croatian (68.3%, a difference of 0.040%).
| Demographics | Rating | Rank | College, Under 1 year |
| Greeks | 98.6 /100 | #79 | Exceptional 68.5% |
| Immigrants | Spain | 98.5 /100 | #80 | Exceptional 68.4% |
| Immigrants | Greece | 98.5 /100 | #81 | Exceptional 68.4% |
| Norwegians | 98.4 /100 | #82 | Exceptional 68.4% |
| Argentineans | 98.4 /100 | #83 | Exceptional 68.4% |
| Immigrants | Hungary | 98.3 /100 | #84 | Exceptional 68.3% |
| Egyptians | 98.3 /100 | #85 | Exceptional 68.3% |
| Immigrants | Lebanon | 98.3 /100 | #86 | Exceptional 68.3% |
| Chinese | 98.3 /100 | #87 | Exceptional 68.3% |
| Croatians | 98.2 /100 | #88 | Exceptional 68.3% |
| Ethiopians | 98.2 /100 | #89 | Exceptional 68.3% |
| Icelanders | 98.1 /100 | #90 | Exceptional 68.3% |
| Europeans | 98.1 /100 | #91 | Exceptional 68.2% |
| Luxembourgers | 98.1 /100 | #92 | Exceptional 68.2% |
| Romanians | 97.9 /100 | #93 | Exceptional 68.2% |
Demographics Similar to Nigerians by College, Under 1 year
In terms of college, under 1 year, the demographic groups most similar to Nigerians are Panamanian (64.3%, a difference of 0.020%), French Canadian (64.2%, a difference of 0.040%), South American (64.2%, a difference of 0.040%), Tsimshian (64.3%, a difference of 0.090%), and Uruguayan (64.2%, a difference of 0.090%).
| Demographics | Rating | Rank | College, Under 1 year |
| Slovaks | 26.7 /100 | #193 | Fair 64.7% |
| Immigrants | Cameroon | 24.6 /100 | #194 | Fair 64.6% |
| Immigrants | South Eastern Asia | 22.1 /100 | #195 | Fair 64.5% |
| Tongans | 21.2 /100 | #196 | Fair 64.5% |
| Costa Ricans | 19.6 /100 | #197 | Poor 64.4% |
| Tsimshian | 17.9 /100 | #198 | Poor 64.3% |
| Panamanians | 17.0 /100 | #199 | Poor 64.3% |
| Nigerians | 16.7 /100 | #200 | Poor 64.3% |
| French Canadians | 16.3 /100 | #201 | Poor 64.2% |
| South Americans | 16.2 /100 | #202 | Poor 64.2% |
| Uruguayans | 15.6 /100 | #203 | Poor 64.2% |
| Immigrants | Zaire | 14.6 /100 | #204 | Poor 64.1% |
| Peruvians | 13.7 /100 | #205 | Poor 64.1% |
| Whites/Caucasians | 12.8 /100 | #206 | Poor 64.0% |
| Colombians | 12.4 /100 | #207 | Poor 64.0% |