Immigrants from Venezuela vs Nigerian Unemployment Among Women with Children Under 6 years
COMPARE
Immigrants from Venezuela
Nigerian
Unemployment Among Women with Children Under 6 years
Unemployment Among Women with Children Under 6 years Comparison
Immigrants from Venezuela
Nigerians
7.1%
UNEMPLOYMENT AMONG WOMEN WITH CHILDREN UNDER 6 YEARS
98.8/ 100
METRIC RATING
81st/ 347
METRIC RANK
8.2%
UNEMPLOYMENT AMONG WOMEN WITH CHILDREN UNDER 6 YEARS
1.1/ 100
METRIC RATING
250th/ 347
METRIC RANK
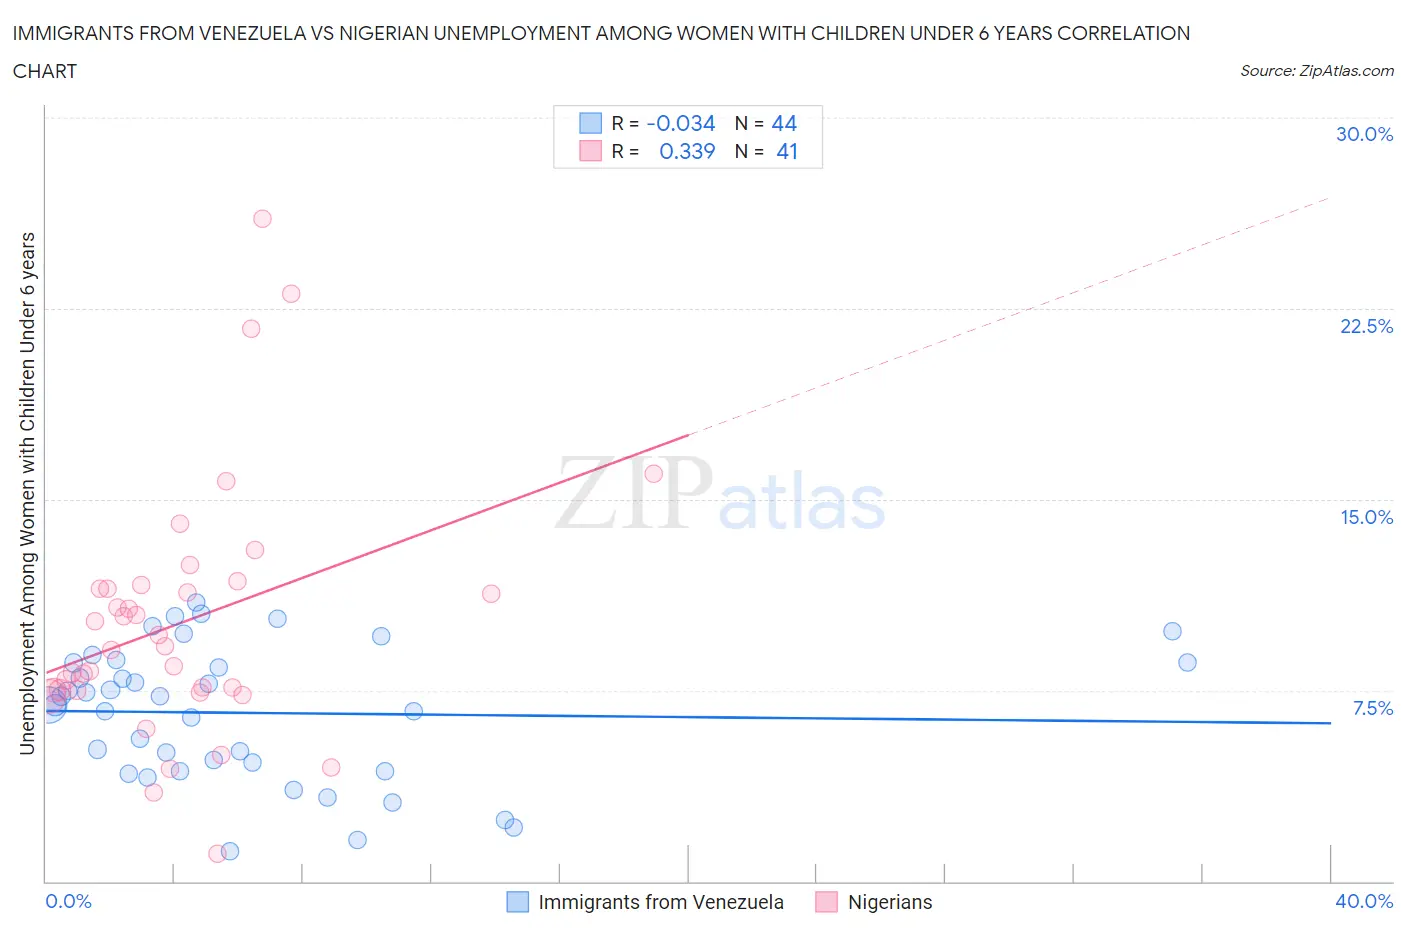
Immigrants from Venezuela vs Nigerian Unemployment Among Women with Children Under 6 years Correlation Chart
The statistical analysis conducted on geographies consisting of 233,969,116 people shows no correlation between the proportion of Immigrants from Venezuela and unemployment rate among women with children under the age of 6 in the United States with a correlation coefficient (R) of -0.034 and weighted average of 7.1%. Similarly, the statistical analysis conducted on geographies consisting of 269,613,333 people shows a mild positive correlation between the proportion of Nigerians and unemployment rate among women with children under the age of 6 in the United States with a correlation coefficient (R) of 0.339 and weighted average of 8.2%, a difference of 16.1%.
Unemployment Among Women with Children Under 6 years Correlation Summary
| Measurement | Immigrants from Venezuela | Nigerian |
| Minimum | 1.2% | 1.1% |
| Maximum | 11.0% | 26.0% |
| Range | 9.8% | 24.9% |
| Mean | 6.6% | 10.2% |
| Median | 7.1% | 9.2% |
| Interquartile 25% (IQ1) | 4.5% | 7.5% |
| Interquartile 75% (IQ3) | 8.6% | 11.6% |
| Interquartile Range (IQR) | 4.1% | 4.1% |
| Standard Deviation (Sample) | 2.6% | 4.9% |
| Standard Deviation (Population) | 2.6% | 4.9% |
Similar Demographics by Unemployment Among Women with Children Under 6 years
Demographics Similar to Immigrants from Venezuela by Unemployment Among Women with Children Under 6 years
In terms of unemployment among women with children under 6 years, the demographic groups most similar to Immigrants from Venezuela are Immigrants from Greece (7.1%, a difference of 0.040%), Immigrants from Fiji (7.1%, a difference of 0.060%), Immigrants from Somalia (7.1%, a difference of 0.11%), Immigrants from Croatia (7.1%, a difference of 0.15%), and Immigrants from Afghanistan (7.1%, a difference of 0.15%).
| Demographics | Rating | Rank | Unemployment Among Women with Children Under 6 years |
| Turks | 99.2 /100 | #74 | Exceptional 7.0% |
| Immigrants | Eastern Europe | 99.0 /100 | #75 | Exceptional 7.1% |
| Estonians | 99.0 /100 | #76 | Exceptional 7.1% |
| Immigrants | Croatia | 98.9 /100 | #77 | Exceptional 7.1% |
| Immigrants | Somalia | 98.9 /100 | #78 | Exceptional 7.1% |
| Immigrants | Fiji | 98.9 /100 | #79 | Exceptional 7.1% |
| Immigrants | Greece | 98.9 /100 | #80 | Exceptional 7.1% |
| Immigrants | Venezuela | 98.8 /100 | #81 | Exceptional 7.1% |
| Immigrants | Afghanistan | 98.7 /100 | #82 | Exceptional 7.1% |
| Egyptians | 98.7 /100 | #83 | Exceptional 7.1% |
| Immigrants | Albania | 98.7 /100 | #84 | Exceptional 7.1% |
| Immigrants | Romania | 98.7 /100 | #85 | Exceptional 7.1% |
| Immigrants | Zimbabwe | 98.6 /100 | #86 | Exceptional 7.1% |
| Alsatians | 98.4 /100 | #87 | Exceptional 7.1% |
| Immigrants | Hungary | 98.3 /100 | #88 | Exceptional 7.1% |
Demographics Similar to Nigerians by Unemployment Among Women with Children Under 6 years
In terms of unemployment among women with children under 6 years, the demographic groups most similar to Nigerians are Immigrants from Sierra Leone (8.2%, a difference of 0.010%), Immigrants from Western Africa (8.2%, a difference of 0.10%), German Russian (8.2%, a difference of 0.14%), Guyanese (8.2%, a difference of 0.17%), and Ghanaian (8.2%, a difference of 0.17%).
| Demographics | Rating | Rank | Unemployment Among Women with Children Under 6 years |
| Hawaiians | 1.8 /100 | #243 | Tragic 8.2% |
| French | 1.7 /100 | #244 | Tragic 8.2% |
| Native Hawaiians | 1.7 /100 | #245 | Tragic 8.2% |
| Central Americans | 1.4 /100 | #246 | Tragic 8.2% |
| German Russians | 1.2 /100 | #247 | Tragic 8.2% |
| Immigrants | Western Africa | 1.1 /100 | #248 | Tragic 8.2% |
| Immigrants | Sierra Leone | 1.1 /100 | #249 | Tragic 8.2% |
| Nigerians | 1.1 /100 | #250 | Tragic 8.2% |
| Guyanese | 1.0 /100 | #251 | Tragic 8.2% |
| Ghanaians | 1.0 /100 | #252 | Tragic 8.2% |
| Immigrants | Guyana | 0.8 /100 | #253 | Tragic 8.2% |
| Immigrants | Caribbean | 0.7 /100 | #254 | Tragic 8.3% |
| Immigrants | Portugal | 0.6 /100 | #255 | Tragic 8.3% |
| Celtics | 0.6 /100 | #256 | Tragic 8.3% |
| British West Indians | 0.5 /100 | #257 | Tragic 8.3% |